Bulgaria Key Figures
- Population:
- 6.43 million
- GDP growth rate:
- 1.85 %/year
- Energy independence:
- 58.7%
Data of the last year available: 2023
- Total consumption/GDP:*
- 55.2 (2005=100)
- CO2 Emissions:
- 4.86 tCO2/capita
- Rate of T&D power losses:
- 7.06%
* at purchasing power parity
View all macro and energy indicators in the Bulgaria energy report
Bulgaria Energy News
View all news, archive your new and create your own daily newsletters only on your topics/countries of interest with Key Energy Intelligence
Bulgaria Energy Research
Benefit from up to 2 000 up-to-date data series for 186 countries in Global Energy & CO2 data
A data overview is available in the global energy statistics app
Bulgaria Total Energy Consumption
Consumption per capita is 2.7 toe (4% lower than the EU average in 2023), with electricity accounting for about 5 000 kWh in 2023 (7% below the EU average in 2023).
Total energy consumption fell by 11% to 17 Mtoe in 2023, in a context of lower lignite-fired power generation and higher electricity imports, after strong growth in 2021 (8.7%) and a slow progression in 2022 (+1.2%).
Interactive Chart Bulgaria Total Energy Consumption
Benefit from up to 2 000 up-to-date data series for 186 countries in Global Energy & CO2 data
View the detailed fondamentals of the market at country level (graphs, tables, analysis) in the Bulgaria energy report
Bulgaria Crude Oil Production
Oil production is very limited (163 kt in 2023). Crude oil imports have averaged 6 Mt/year since 2010 and 2020. In 2023, they dipped by 11% to 6.4 Mt, after a 39% fall between 2019 and 2021 and a 69% rebound in 2022. Crude oil imports mainly came from Russia (89% in 2023).
Bulgaria has a large refinery located in Burgas with a capacity of 195 kb/d (nearly 10 Mt/year, but including 2.8 Mt/year not used). Bulgaria produced 6.7 Mt of oil products in 2023 (-8% on 2022) and exported 3.5 Mt of oil products (-15%).
Interactive Chart Bulgaria Crude Oil Production
Benefit from up to 2 000 up-to-date data series for 186 countries in Global Energy & CO2 data
Additionally, for more detailed information on refineries, you can request a sample of our EMEA Refineries Dataset
Bulgaria Oil Products Consumption
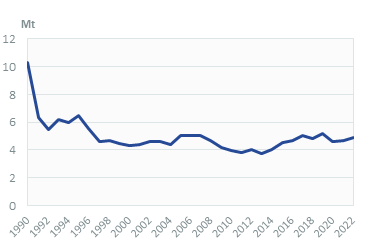
Oil product consumption dipped by 5.3% to 4.6 Mt in 2023, after two years of rebound following the 9.6% drop in 2020.
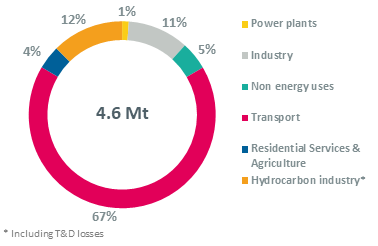
Transport absorbs 2/3 of oil product consumption (2023), while industry accounts for 16% (including non-energy uses).
Graph: OIL CONSUMPTION (Mt)
Graph: OIL CONSUMPTION BREAKDOWN BY SECTOR (2023, %)
Interactive Chart Bulgaria Refined Oil Products Production
Benefit from up to 2 000 up-to-date data series for 186 countries in Global Energy & CO2 data
Additionally, for more detailed information on refineries, you can request a sample of our EMEA Refineries Dataset
Bulgaria Natural Gas Consumption
Gas consumption fell by 20% in 2022 and by 5.5% in 2023 to 2.6 bcm, in a context of soaring gas prices and constrained supply. After remaining stable around 3 bcm over 2010-2019, gas consumption increased slightly in 2020 (+3%) and grew by 13% in 2021 to 3.4 bcm.
Industry remains the largest gas consumer, with a share of 39%, including non-energy uses, followed by the power sector (26%) and households and services (8%); these shares have been stable since 2010.
Graph: NATURAL GAS CONSUMPTION (bcm)
Interactive Chart Bulgaria Natural Gas Domestic Consumption
Benefit from up to 2 000 up-to-date data series for 186 countries in Global Energy & CO2 data
Additionally, for more detailed information on the LNG trade, you can request a sample of our EMEA LNG Trade Dataset
Bulgaria Coal Consumption
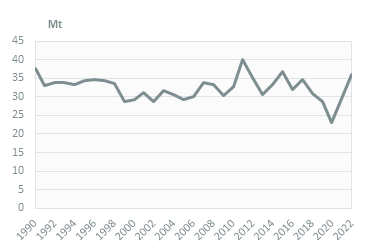
In 2023, high CO2 prices, stricter pollution standards and the competition from solar led to a 51% fall in lignite consumption, to a record low of 17.5 Mt. This consumption has been evolving erratically since 2009, with a decrease of 9%/year between 2017 and 2019 and of 20% in 2020, followed by growth of 24%/year on average until 2022 to 36 Mt.
The power sector is the main consumer of coal and lignite (86% in 2023).
Graph: COAL CONSUMPTION (Mt)
Interactive Chart Bulgaria Coal and Lignite Domestic Consumption
Benefit from up to 2 000 up-to-date data series for 186 countries in Global Energy & CO2 data
View the detailed consumption trends at country level (graphs, tables, analysis) in the Bulgaria energy report
Bulgaria Power Consumption
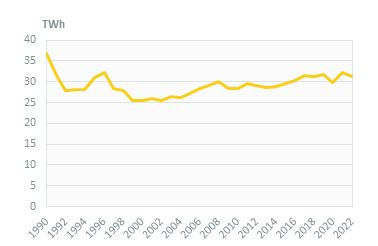
Electricity consumption remained roughly stable in 2022 and 2023, at around 32 TWh, in a context of surging electricity prices; it rebound by 7.6% in 2021 following a 5.9% drop in 2020. Overall, electricity consumption has increased at a slow rate (+1%/year) since 2000.
The residential sector is the largest electricity consumer (37% of the total in 2023), followed by industry (30%) and services (26%).
Graph: ELECTRICITY CONSUMPTION (TWh)
Bulgaria Renewable in % Electricity Production
In its draft updated NECP (2024), the country set a target of 34.1% of renewables in final energy consumption by 2030, including 42.2% for electricity, 45.5% for heating and cooling, and 15.2% for transport. This share was 19.1% in 2022 (down from 23.3% in 2020), including 20.2% for electricity, 31.7% for heating and cooling, and 7.7% for transport.
The 2020 target of 16% of renewables in final consumption was exceeded in 2012.
As detailed in the draft updated NECP, Bulgaria will have to add nearly 4.8 GW of renewables to meet its 2030 target, mainly solar and wind.
Interactive Chart Bulgaria Share of Renewables in Electricity Production (incl hydro)
Benefit from up to 2 000 up-to-date data series for 186 countries in Global Energy & CO2 data
Learn more about renewables in the European Battery Market Analysis
Bulgaria CO2 Fuel Combustion/CO2 Emissions
GHG emissions, which had been declining by more than 6%/year between 2015 and 2020 (including a 13% fall in 2020 due to the COVID-19 pandemic), rebounded by 16% in 2021 and by 10% in 2022 to nearly 49 MtCO2eq. This is 40% below their 1990 level. GHG emissions halved between 1988 and 2000, before rising by 3.5%/year until 2008.