China Key Figures
- Population:
- 1412 million
- GDP growth rate:
- 2.99 %/year
- Energy independence:
- 82.7%
Data of the last year available: 2022
- Total consumption/GDP:*
- 58.8 (2005=100)
- CO2 Emissions:
- 7.68 tCO2/capita
- Rate of T&D power losses:
- 4.09%
* at purchasing power parity
View all macro and energy indicators in the China energy report
China Related News
View all news, archive your new and create your own daily newsletters only on your topics/countries of interest with Key Energy Intelligence
China Related Research
Benefit from up to 2 000 up-to-date data series for 186 countries in Global Energy & CO2 data
A data overview is available in the global energy statistics app
Total Energy Consumption
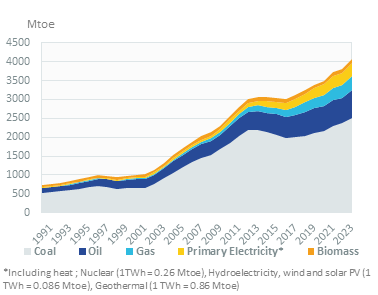
Total energy consumption per capita is increasing regularly, reaching 2.7 toe/cap in 2022 (nearly 4 times that for India). Electricity consumption per capita increased by over 4% to around 5 800 kWh in 2022, more than twice the 2010 levels.
Graph: CONSUMPTION TRENDS BY ENERGY SOURCE (Mtoe)
Interactive Chart China Total Energy Consumption
Benefit from up to 2 000 up-to-date data series for 186 countries in Global Energy & CO2 data
View the detailed fondamentals of the market at country level (graphs, tables, analysis) in the China energy report
Crude Oil Production
Oil production has been increasing since 2018 (+2%/year), reaching 216 Mt in 2022. It declined by 3.2%/year between 2015 and 2018, after increasing by 2%/year between 2000 and 2015. Most of the production is onshore and located in the fields close to the north-eastern coast. Offshore production is in full development, with the Bohai basin being one of the most active areas.
Interactive Chart China Crude Oil Production
Benefit from up to 2 000 up-to-date data series for 186 countries in Global Energy & CO2 data
Additionally, for more detailed information on refineries, you can request a sample of our Asia Refineries Dataset
Oil Products Consumption
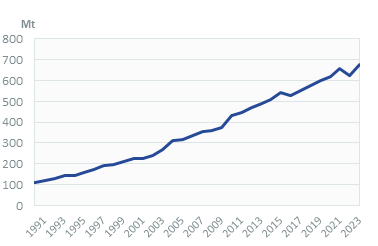
The consumption of oil products increased rapidly between 2010 and 2021 (+4%/year on average) and slowed down in 2022 (+1%) to around 690 Mt.
In 2022, the share of the transport sector remained stable at 42%; the second largest energy consuming sector is industry (including non-energy uses) with around 37%.
Graph: OIL CONSUMPTION (Mt)
Graph: OIL CONSUMPTION BREAKDOWN BY SECTOR (2022, %)
Interactive Chart China Refined Oil Products Production
Benefit from up to 2 000 up-to-date data series for 186 countries in Global Energy & CO2 data
Additionally, for more detailed information on refineries, you can request a sample of our Asia Refineries Dataset
Natural Gas Consumption
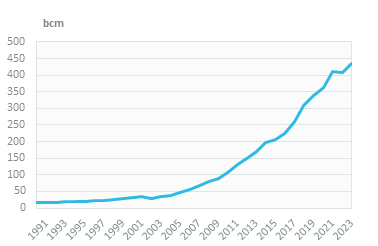
Natural gas consumption decreased slightly in 2022 to 364 bcm (-1%), after 12% growth in 2021, which was in line with the 2010-2019 trend. Despite the effects of the pandemic, gas consumption grew by 6% in 2020.
Industry represented 43% of gas demand in 2022, followed by the residential and services sector (20%), the power sector (19%), and transport (9%).
Graph: NATURAL GAS CONSUMPTION (bcm)
Graph: GAS CONSUMPTION BREAKDOWN BY SECTOR (2022, %)
Interactive Chart China Natural Gas Domestic Consumption
Benefit from up to 2 000 up-to-date data series for 186 countries in Global Energy & CO2 data
Additionally, for more detailed information on the LNG trade, you can request a sample of our Asia LNG Trade Dataset
Coal Consumption
Coal and lignite consumption recovered noticeably in 2021 and 2022 (+4.6% and +7.3%, respectively), surpassing 4.5 Gt, after moderate growth between 2017 and 2020 (1%/year) and a decrease from 2014 to 2016 (-1.9%/year). It increased very rapidly between 2000 and 2013 (+9%/year).
The power sector is the largest user of coal and lignite in 2022, with 67%, followed by industry (24%). The share of the power sector has been increasing continually (45% in 2000 and 49% in 2010).
Graph: COAL CONSUMPTION (Mt)
Interactive Chart China Coal and Lignite Domestic Consumption
Benefit from up to 2 000 up-to-date data series for 186 countries in Global Energy & CO2 data
View the detailed consumption trends at country level (graphs, tables, analysis) in the China energy report
Power Consumption
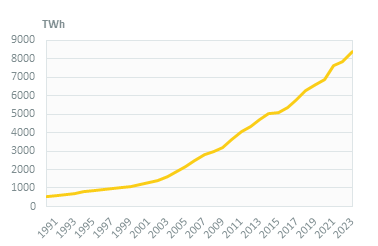
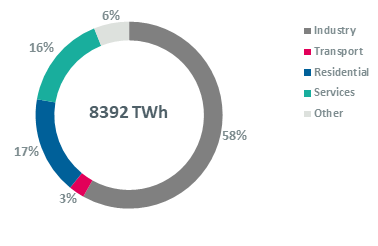
Electricity consumption rose by 4% in 2022 to 8 220 TWh, after a 10% jump in 2021. Consumption increased by 7%/year over 2010-2021.
Industry is the main consumer (55% in 2022), followed by services and residential (20% and 17%, respectively).
Graph: ELECTRICITY CONSUMPTION (TWh)
Graph: ELECTRICITY CONSUMPTION BREAKDOWN BY SECTOR (2022,%)
Renewable in % Electricity Production
With the 14th FYP, the country intends to get 20% of its total energy consumption from non-fossil fuels in 2025 (14% in 2021). The target of 15% of renewables in total energy consumption in 2020 was not reached (only 10%) ("Guiding Opinions on Establishing Renewable Energy Portfolio Standards", NEA, 2016). In 2018, the NDRC also set a target of a 9% share of non-hydro renewables in electricity consumption for 2020 and 35% in 2030 (11% reached in 2020 and 13% in 2022).
Interactive Chart China Share of Renewables in Electricity Production (incl hydro)
Benefit from up to 2 000 up-to-date data series for 186 countries in Global Energy & CO2 data
Learn more about renewables in the Mini grid Africa & Asia markets for village electrification
CO2 Fuel Combustion/CO2 Emissions
In its updated NDC (2021), China set more ambitious targets for 2030: reaching a CO2 emission peak before 2030, lowering its CO2 intensity by over 65% (from 2005 levels), and eventually reaching carbon neutrality before 2060. It aims to cut the average coal consumption rate in power plants to 300g/kWh between 2020 and 2025.