
- Update
-
- Format
- 4 files (PDF report, 3 Excel files)
- Pages
-
38 (Report only)
- Delivery
- Immediate by e-mail
- GENERAL OVERVIEW
- INSTITUTIONS AND ENERGY POLICY
- ENERGY COMPANIES
- ENERGY SUPPLY
- ENERGY PRICES
- ENERGY CONSUMPTION
- DATA TABLES
- ABBREVIATIONS
- GLOSSARY
Buy Austria energy report
Price without VAT. Depending on your statute and location, VAT might be applicable. Get in touch with us for more information.
After validation, you will immediately receive 4 files by email (one pdf report and 3 excel files containing the datasets).
Overview
This analysis includes a comprehensive Austria energy market report and updated datasets. It is derived from the most recent key economic indicators, supply and demand factors, oil and gas pricing trends and major energy issues and developments surrounding the energy industry. The report provides a complete picture of the country situation, dynamics, current issues and future prospects. With market data and continuous follow-up of markets news, this report brings clear and concise insights with which to tackle national energy challenges and opportunities. Browse the tabs below for a detailed table of contents, the list of graphs and tables, and details on the data files.
Highlights
- Austria aims to achieve 100% of renewables in the power mix in 2030 and carbon neutrality in 2040.
- OMV dominates the oil and gas market.
- Most of the power companies are controlled by public institutions. Verbund is the largest power generator and EnergieAllianz Austria the largest supplier.
- Renewables account for 80% of the power mix.
- Gas imports were mutliplied by 2.6 in 2022, but the share of Russian gas decreased from more than 90% in 2021 to around 60% in 2022 and 65% in 2023.
- Because of its low refining capacity, Austria buys half of its demand of petroleum products abroad.
- Since end-2022, electricity prices are capped for households to counterbalance rising costs.
- Energy subsidies were introduced for energy intensive industries in 2022 and extended to all companies for 2023.
- Energy consumption decreased by 6% in 2022.
- Industry is the main driver of electricity consumption growth.
- Most of the investments in the power sector are directed to new hydropower projects.
- Austria aims to reinforce its gas interconnections and to build a strong hydrogen-compatible network to become a transit hub.
Institutions & Energy Policy
The Directorate General for Energy & Mining of the Federal Ministry for Climate Action, Environment, Energy, Mobility, Innovation, and Technology is responsible for the energy policy and supervises the energy sector. The ministry is also in charge of environmental and climate protection policies.
Energy Companies
Gas:
The gas market is characterised by a high level of provincial and local ownership.
Energy Supply
Resources:
Austria's limited energy resources consist of hydrocarbons (4.6 bcm for gas and 5 Mt for oil at end-2022).
Energy Prices
Electricity:
Industry prices have more than doubled since 2020, while prices for households jumped by 15%. To reduce the still growing electricity costs, the government introduced a price cap on electricity for all households in January 2023 until at least June 30th, 2024. Companies have been benefiting from the "energy cost subsidy 1 & 2" since September 2022.
Energy Consumption
Austria's energy consumption per capita decreased to 3.5 toe (-7%), which is 17% higher than the EU average (2022). The country's electricity consumption stands at 7 200 kWh (-4%) i.e. 30% above the EU average.
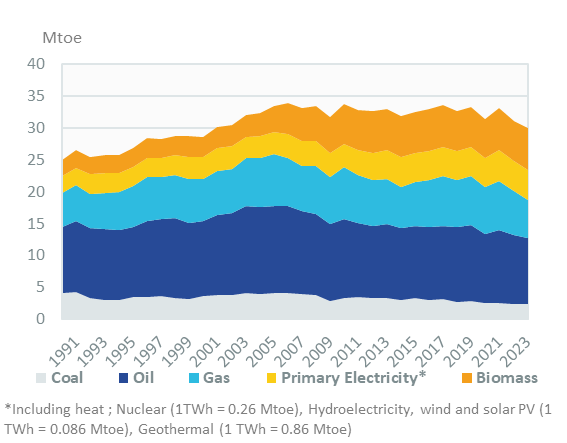
Graph: CONSUMPTION TRENDS BY ENERGY SOURCE (Mtoe)
- GRAPH 1: CO2-energy emissions (MtCO2)
- GRAPH 2: Installed electric capacity by source (2022, %)
- GRAPH 3: Gross power production by source (TWh)
- GRAPH 4: Power generation by source (2022, %)
- GRAPH 5: Gasoline & diesel prices (€/l)
- GRAPH 6: Electricity prices for industry and households (€c/kWh)
- GRAPH 7: Gas prices for industry and households (€c/kWh GCV)
- GRAPH 8: Consumption trends by energy source (Mtoe)
- GRAPH 9: Total consumption market share by energy (2022, %)
- GRAPH 10: Final consumption market share by sector (2022, %)
- GRAPH 11: Oil consumption (Mt)
- GRAPH 12: Oil consumption breakdown by sector (2022, %)
- GRAPH 13: Electricity consumption (TWh)
- GRAPH 14: Electricity consumption breakdown by sector (2022, %)
- GRAPH 15: Natural gas consumption (bcm)
- GRAPH 16: Gas consumption breakdown by sector (2022, %)
- GRAPH 17: Coal consumption (Mt)
- GRAPH 18: Coal consumption breakdown by sector (2022, %)
- Economic Indicators: Annual historical data including population, GDP growth, imports and exports, inflation rate, energy security and efficiency indicators, CO2 emissions.
- Supply Indicators: Historical data including oil and gas reserves, electric and refining capacity, energy production, power production and external trade. All are detailed by energy source.
- Demand Indicators: Historical data including consumption per inhabitant, consumption trends, total consumption by energy source, final consumption by energy source and sector, and electricity consumption by sector.
- Energy Balances: Single table displaying the overall energy industry balance per annum, also graphically displayed by energy sub-segment.
- Infrastructure Projects: Covers power plant projects by energy, technology, status and operator.
The Austria energy market data since 1990 and up to
is included in the Excel file accompanying the Austria country report.
It showcases the historical evolution, allowing users to easily work with the data.
Key Data included in the excelsheet:
- Economic indicators: Annual historical economic indicators, energy security, energy efficiency and CO2 emissions.
- Supply indicators: Annual historical reserves, capacity, production and external trade (imports(+) exports(-) balance).
- Demand indicators: Annual historical consumption per capita, consumption trends, total consumption, final consumption (per energy and per sector) and electricity consumption total and per sector.
- Energy Balance: total and per energy.
- Austria Energy Prices: In addition to the analysis provided on the report we also provided a data set which includes historical details on the Austria energy prices for the follow items: price of premium gasoline (taxes incl.), price of diesel (taxes incl.), price of electricity in industry (taxes incl.), price of electricity for households (taxes incl.), price of natural gas in industry (taxes incl.), prices of natural gas for households (taxes incl.), spot price of Brent and CO2 emissions (from fuel combustion).
The Austria country dashboards are complemented with country forecasts from EnerFuture (excel file) with scenario comparison.
Data included in the excelsheet:
- Demand: Primary energy consumption, final energy consumption, by fuel, by sector.
- Power: Electricity generation & capacities, by technology.
- CO2: Total CO2 emissions.
- Macro-economy: Main macro-economic assumptions.
- Key indicators: Energy intensity, share of renewables, CO2 emissions per capita and per unit of GDP.