
- Update
-
- Format
- 4 files (PDF report, 3 Excel files)
- Pages
-
41 (Report only)
- Delivery
- Immediate by e-mail
- GENERAL OVERVIEW
- INSTITUTIONS AND ENERGY POLICY
- ENERGY COMPANIES
- ENERGY SUPPLY
- ENERGY PRICES
- ENERGY CONSUMPTION
- ISSUES AND PROSPECTS
- DATA TABLES
- ABBREVIATIONS
- GLOSSARY
Buy Croatia energy report
Price without VAT. Depending on your statute and location, VAT might be applicable. Get in touch with us for more information.
After validation, you will immediately receive 4 files by email (one pdf report and 3 excel files containing the datasets).
Overview
This analysis includes a comprehensive Croatia energy market report and updated datasets. It is derived from the most recent key economic indicators, supply and demand factors, oil and gas pricing trends and major energy issues and developments surrounding the energy industry. The report provides a complete picture of the country situation, dynamics, current issues and future prospects. With market data and continuous follow-up of markets news, this report brings clear and concise insights with which to tackle national energy challenges and opportunities. Browse the tabs below for a detailed table of contents, the list of graphs and tables, and details on the data files.
Highlights
- Croatia exceeded by more than 10 points its renewable target in 2020 and now aims at a share of 42.5% of renewables in the final consumption in 2030.
- HEP, a state-owned company, dominates the electricity market, with around 70% of generation and over 90% of retail electricity sales.
- INA is the sole oil and gas producer.
- The power mix is highly dependent on hydropower.
- Oil production is marginal and gas production is decreasing rapidly.
- The government introduced support measures to limit the surge in energy prices in 2022 and 2023.
- Energy consumption declined again in 2022.
- Renewables cover 32% of total energy consumption in 2022.
- Plinacro plans to double the capacity of the Krk LNG terminal to 6.1 bcm/year and convert its gas transmission networks to use hydrogen.
Institutions & Energy Policy
The Ministry of Economy and Sustainable Development oversees the energy policy through the Energy Directorate, along with environment and climate change matters.
The Energy Regulation Agency (HERA), created in 2004, regulates the energy sector and controls electricity and gas prices, except for feed-in tariffs, biofuels and CHP (consulting role).
Energy Companies
Electricity:
In 2013, HEP (100% State owned) was split into five entities dealing with electricity generation, transmission, distribution, supply, and trade.
Energy Supply
Resources:
Croatia has limited oil and gas resources (10 Mt and 4.7 bcm end of 2022) and no coal reserves. Its renewable potential is estimated at 37 GW for wind (of which, 25 GW offshore), at 6.8 GW for solar (of which, 1.5 GW for rooftop), and at 0.5 GW for geothermal.
Energy Prices
Gas:
Gas prices for industrial customers, which were rather stable between 2016 and 2020, started to rise in 2021 (+47% in 2021, followed by an 84% surge in 2022) before falling by 17% in 2023. For households, prices only grew by 12% in 2022 and decreased by 5% in 2023.
Energy Consumption
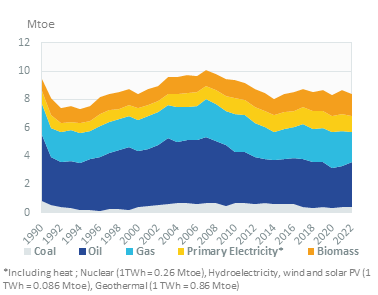
Energy consumption per capita is stable at 2.2 toe, with electricity accounting for 4 300 kWh (2022). These figures are around 25% below the EU averages.
Graph: CONSUMPTION TRENDS BY ENERGY SOURCE (Mtoe)
Issues & Prospects
According to its draft update NECP (National Energy and Climate Plan), primary energy consumption and final energy consumption should decrease to 341 PJ (8.1 Mtoe) and 274 PJ (6.6 Mtoe), respectively.
- GRAPH 1: CO2-energy emissions (MtCO2)
- GRAPH 2: Installed electric capacity by source (2022, %)
- GRAPH 3: Gross power production by source (TWh)
- GRAPH 4: Power generation by source (2022, %)
- GRAPH 5: Gasoline & diesel prices (€/l)
- GRAPH 6: Electricity prices for industry and households (€c/kWh)
- GRAPH 7: Gas prices for industry and households (€c/kWh GCV)
- GRAPH 8: Consumption trends by energy source (Mtoe)
- GRAPH 9: Total consumption market share by energy (2022, %)
- GRAPH 10: Final consumption market share by sector (2022, %)
- GRAPH 11: Oil consumption (Mt)
- GRAPH 12: Oil consumption breakdown by sector (2022, %)
- GRAPH 13: Electricity consumption (TWh)
- GRAPH 14: Electricity consumption breakdown by sector (2022, %)
- GRAPH 15: Natural gas consumption (bcm)
- GRAPH 16: Gas consumption breakdown by sector (2022, %)
- GRAPH 17: Coal consumption (Mt)
- GRAPH 18: Coal consumption breakdown by sector (2022, %)
- Economic Indicators: Annual historical data including population, GDP growth, imports and exports, inflation rate, energy security and efficiency indicators, CO2 emissions.
- Supply Indicators: Historical data including oil and gas reserves, electric and refining capacity, energy production, power production and external trade. All are detailed by energy source.
- Demand Indicators: Historical data including consumption per inhabitant, consumption trends, total consumption by energy source, final consumption by energy source and sector, and electricity consumption by sector.
- Energy Balances: Single table displaying the overall energy industry balance per annum, also graphically displayed by energy sub-segment.
- Infrastructure Projects: Covers power plant projects by energy, technology, status and operator, gas plant projects by status and operator and LNG contracts.
The Croatia energy market data since 1990 and up to
is included in the Excel file accompanying the Croatia country report.
It showcases the historical evolution, allowing users to easily work with the data.
Key Data included in the excelsheet:
- Economic indicators: Annual historical economic indicators, energy security, energy efficiency and CO2 emissions.
- Supply indicators: Annual historical reserves, capacity, production and external trade (imports(+) exports(-) balance).
- Demand indicators: Annual historical consumption per capita, consumption trends, total consumption, final consumption (per energy and per sector) and electricity consumption total and per sector.
- Energy Balance: total and per energy.
- Croatia Energy Prices: In addition to the analysis provided on the report we also provided a data set which includes historical details on the Croatia energy prices for the follow items: price of premium gasoline (taxes incl.), price of diesel (taxes incl.), price of electricity in industry (taxes incl.), price of electricity for households (taxes incl.), price of natural gas in industry (taxes incl.), prices of natural gas for households (taxes incl.), spot price of Brent and CO2 emissions (from fuel combustion).
The Croatia country dashboards are complemented with country forecasts from EnerFuture (excel file) with scenario comparison.
Data included in the excelsheet:
- Demand: Primary energy consumption, final energy consumption, by fuel, by sector.
- Power: Electricity generation & capacities, by technology.
- CO2: Total CO2 emissions.
- Macro-economy: Main macro-economic assumptions.
- Key indicators: Energy intensity, share of renewables, CO2 emissions per capita and per unit of GDP.