
- Update
-
- Format
- 3 files (PDF report, 2 Excel files)
- Pages
-
26 (Report only)
- Delivery
- Immediate by e-mail
- GENERAL OVERVIEW
- INSTITUTIONS AND ENERGY POLICY
- ENERGY COMPANIES
- ENERGY SUPPLY
- ENERGY PRICES
- ENERGY CONSUMPTION
- ISSUES AND PROSPECTS
- DATA TABLES
- ABBREVIATIONS
- GLOSSARY
Buy Hong Kong energy report
Price without VAT. Depending on your statute and location, VAT might be applicable. Get in touch with us for more information.
After validation, you will immediately receive 3 files by email (one pdf report and 2 excel files containing the datasets).
Overview
This analysis includes a comprehensive Hong Kong energy market report and updated datasets. It is derived from the most recent key economic indicators, supply and demand factors, oil and gas pricing trends and major energy issues and developments surrounding the energy industry. The report provides a complete picture of the country situation, dynamics, current issues and future prospects. With market data and continuous follow-up of markets news, this report brings clear and concise insights with which to tackle national energy challenges and opportunities. Browse the tabs below for a detailed table of contents, the list of graphs and tables, and details on the data files.
Highlights
- Hong Kong plans to reduce its CO2 intensity to GDP by 65-70% by 2030.
- CLP Holdings is the main electric utility, holding 70% of the capacity and supplying 80% of consumers.
- Towngas has the monopoly over gas supply.
- Hong Kong is dependent on energy imports, mostly from China.
- Coal dominated the power mix until 2019 and is being replaced by gas.
- Gasoline and diesel prices are around two times higher than in mainland China, mainly due to higher taxes.
- Electricity prices are also two times higher for industry and 70% higher for households.
- The service sector consumes two thirds of electricity.
- Gas has the largest share in total energy consumption (33% in 2022) and is replacing coal (-13 pp since 2019).
- As part of its Climate Action Plan 2030+, the country is phasing out coal-fired power and shifting to natural gas and renewables. Hong Kong has the potential to produce 3-4% of its electricity from RES in 2030.
Institutions & Energy Policy
The Government does not have a specific entity to control the energy sector. The responsibility for the regulation of the electricity and gas sectors is shared between several departments: the Commerce and Economic Development Bureau, the Electrical and Mechanical Services Department (in particular the Gas Standards Office), the Treasury, and the Environment and Ecology Bureau.
Energy Companies
Oil:
The oil sector is made up of local companies that are mainly present in Southeast Asia. The main one, SS United Group Oil & Gas Company Limited (UEG), is a trading company that sells oil products in China, Russia, Japan, Thailand, and Malaysia. The group also has production infrastructures in Pakistan, the Middle East, and North Africa.
Energy Supply
Resources:
The territory of Hong Kong does not have any oil or gas resources. The potential of renewables is as follows: 6 TWh for solar PV, 2.6 TWh for onshore wind and 8 TWh for offshore wind.
Energy Prices
Gas:
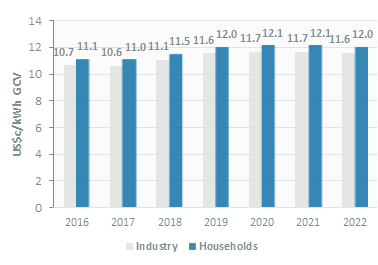
Gas prices increased steadily until 2020; since then, prices have stabilised, reaching US$11.6c/kWh for industry and US$12c/kWh for households in 2022.
Graph: GAS PRICES FOR INDUSTRY AND HOUSEHOLDS (€C/KWH GCV)
Energy Consumption
Total energy consumption per capita was 1.6 toe in 2022. Per capita electricity consumption is about 6.1 MWh.
Total energy consumption decreased by 6% in 2022 to 11.7 Mtoe, after remaining stable in 2021 and declining by 8.5% in 2020. Previously, it had been fluctuating around 14 Mtoe since 2007.
Issues & Prospects
Electricity:
The country's priority is to develop renewables. The ENB estimates that Hong Kong only has an achievable potential of 3-4% of total electricity consumed from wind, solar and waste-to-energy sources until 2030.
the "Climate Action Plan 2030 implies a gradual phasing out of coal-fired power by 2030.
- GRAPH 1: CO2-energy Emissions (MtCO2)
- GRAPH 2: Installed electric capacity by source (2022, %)
- GRAPH 3: Gross power production by source (TWh)
- GRAPH 4: Power generation by source (2022, %)
- GRAPH 5: Gasoline & diesel prices (US$/l)
- GRAPH 6: ELECTRICITY PRICES FOR INDUSTRY AND HOUSEHOLDS (US$c/kWh)
- GRAPH 7: Gas prices for industry and households (€c/kWh GCV)
- GRAPH 8: Consumption trends by energy source (Mtoe)
- GRAPH 9: Total consumption market share by energy (2022, %)
- GRAPH 10: Final consumption market share by sector (2022, %)
- Economic Indicators: Annual historical data including population, GDP growth, imports and exports, inflation rate, energy security and efficiency indicators, CO2 emissions.
- Supply Indicators: Historical data including oil and gas reserves, electric and refining capacity, energy production, power production and external trade. All are detailed by energy source.
- Demand Indicators: Historical data including consumption per inhabitant, consumption trends, total consumption by energy source, final consumption by energy source and sector, and electricity consumption by sector.
- Energy Balances: Single table displaying the overall energy industry balance per annum, also graphically displayed by energy sub-segment.
- Infrastructure Projects: Covers power plant projects by energy, technology, status and operator.
The Hong Kong energy market data since 1990 and up to
is included in the Excel file accompanying the Hong Kong country report.
It showcases the historical evolution, allowing users to easily work with the data.
Key Data included in the excelsheet:
- Economic indicators: Annual historical economic indicators, energy security, energy efficiency and CO2 emissions.
- Supply indicators: Annual historical reserves, capacity, production and external trade (imports(+) exports(-) balance).
- Demand indicators: Annual historical consumption per capita, consumption trends, total consumption, final consumption (per energy and per sector) and electricity consumption total and per sector.
- Energy Balance: total and per energy.
- Hong Kong Energy Prices: In addition to the analysis provided on the report we also provided a data set which includes historical details on the Hong Kong energy prices for the follow items: price of premium gasoline (taxes incl.), price of diesel (taxes incl.), price of electricity in industry (taxes incl.), price of electricity for households (taxes incl.), price of natural gas in industry (taxes incl.), prices of natural gas for households (taxes incl.), spot price of Brent and CO2 emissions (from fuel combustion).