
- Update
-
- Format
- 3 files (PDF report, 2 Excel files)
- Pages
-
31 (Report only)
- Delivery
- Immediate by e-mail
- GENERAL OVERVIEW
- INSTITUTIONS AND ENERGY POLICY
- ENERGY COMPANIES
- ENERGY SUPPLY
- ENERGY PRICES
- ENERGY CONSUMPTION
- ISSUES AND PROSPECTS
- DATA TABLES
- ABBREVIATIONS
- GLOSSARY
Buy Kenya energy report
Price without VAT. Depending on your statute and location, VAT might be applicable. Get in touch with us for more information.
After validation, you will immediately receive 3 files by email (one pdf report and 2 excel files containing the datasets).
Overview
This analysis includes a comprehensive Kenya energy market report and updated datasets. It is derived from the most recent key economic indicators, supply and demand factors, oil and gas pricing trends and major energy issues and developments surrounding the energy industry. The report provides a complete picture of the country situation, dynamics, current issues and future prospects. With market data and continuous follow-up of markets news, this report brings clear and concise insights with which to tackle national energy challenges and opportunities. Browse the tabs below for a detailed table of contents, the list of graphs and tables, and details on the data files.
Highlights
- The country's electrification rate soared from 19% in 2010 to 77% in 2021.
- Kenya targets a share of 100% of renewables in the power mix and a reduction of GHG emissions by 32% in 2030.
- KenGen still accounts for around two thirds of power generation, despite a growing market share for IPPs.
- KPLC and KETRACO, two state-owned transmission companies, are rapidly extending the power grid.
- Geothermal provided 43% of the power mix in 2022.
- The share of geothermal, wind, and solar has increased by 40 points since 2010.
- The price of oil products increased by over 40% between 2020 and 2023.
- Electricity prices have increased sharply since 2021: by 60% for industry and almost 80% for households.
- The share of renewable electricity in the country's energy mix has increased by 10 points since 2010, reaching 18% in 2022.
- Kenya plans to triple its power capacity by 2030.
Institutions & Energy Policy
The Ministry of Energy (MoE) is in charge of the country's energy policy and development.
The Ministry of Petroleum and Mining (MPM) oversees the management of fossil natural resources (oil, gas, and minerals) and related policies.
Energy Companies
Oil:
National Oil Corporation of Kenya (NOCK, 100% state-owned) is involved in all aspects of the hydrocarbon supply chain covering the upstream oil and gas exploration, midstream petroleum infrastructure development, and downstream marketing of petroleum products. Kenya is planning to privatize NOCK, among other public companies.
Energy Supply
Resources:
Kenya does not currently have oil and gas reserves. However, the country's renewable potential is significant, with 53 GW of hydroelectric resources and 7-10 GW of geothermal resources.
Energy Prices
Oil:
EPRA is mandated to set the wholesale and retail prices of petroleum and petroleum products.
In 2023, the average price of gasoline in dollars was US$1.40/l and of diesel US$1.28/l. These prices tend to follow international prices: they increased by 44% between 2020 and 2023.
Graph: GASOLINE & DIESEL PRICES (US$/l)
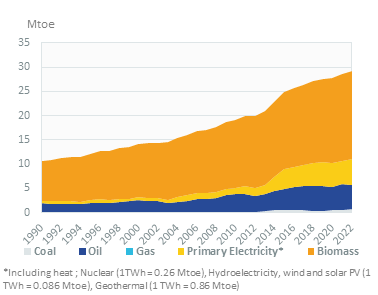
Energy Consumption
Total per capita energy consumption is around 0.54 toe (2022). Per capita electricity consumption is around 190 kWh, which is much higher than neighbour countries (30% higher than in Tanzania, twice that in Uganda).
Graph: CONSUMPTION TRENDS BY ENERGY SOURCE (Mtoe)
Issues & Prospects
Oil:
In 2021, Tullow Oil presented its revised development plan for oil production in Turkana County (Lokichar project). A draft Field Development Plan was submitted to the Ministry of Energy & Petroleum. The company, which raised the project's gross budget to about KES374bn (US$3.4bn), plans to produce 120 kb/d and to recover 585 mbl over the full life of the field.
- GRAPH 1: CO2-energy emissions (MtCO2)
- GRAPH 2: Installed electric capacity by source (2022, %)
- GRAPH 3: Gross power production by source (TWh)
- GRAPH 4: Power generation by source (2022, %)
- GRAPH 5: Gasoline & diesel prices (US$/l)
- GRAPH 6: Electricity prices for industry and households (US$c/kWh)
- GRAPH 7: Consumption trends by energy source (Mtoe)
- GRAPH 8: Total consumption market share by energy (2022, %)
- GRAPH 9: Final consumption market share by sector (2022, %)
- Economic Indicators: Annual historical data including population, GDP growth, imports and exports, inflation rate, energy security and efficiency indicators, CO2 emissions.
- Supply Indicators: Historical data including oil and gas reserves, electric and refining capacity, energy production, power production and external trade. All are detailed by energy source.
- Demand Indicators: Historical data including consumption per inhabitant, consumption trends, total consumption by energy source, final consumption by energy source and sector, and electricity consumption by sector.
- Energy Balances: Single table displaying the overall energy industry balance per annum, also graphically displayed by energy sub-segment.
- Infrastructure Projects: Covers power plant projects by energy, technology, status and operator.
The Kenya energy market data since 1990 and up to
is included in the Excel file accompanying the Kenya country report.
It showcases the historical evolution, allowing users to easily work with the data.
Key Data included in the excelsheet:
- Economic indicators: Annual historical economic indicators, energy security, energy efficiency and CO2 emissions.
- Supply indicators: Annual historical reserves, capacity, production and external trade (imports(+) exports(-) balance).
- Demand indicators: Annual historical consumption per capita, consumption trends, total consumption, final consumption (per energy and per sector) and electricity consumption total and per sector.
- Energy Balance: total and per energy.
- Kenya Energy Prices: In addition to the analysis provided on the report we also provided a data set which includes historical details on the Kenya energy prices for the follow items: price of premium gasoline (taxes incl.), price of diesel (taxes incl.), price of electricity in industry (taxes incl.), price of electricity for households (taxes incl.), price of natural gas in industry (taxes incl.), prices of natural gas for households (taxes incl.), spot price of Brent and CO2 emissions (from fuel combustion).