
- Update
-
- Format
- 4 files (PDF report, 3 Excel files)
- Pages
-
39 (Report only)
- Delivery
- Immediate by e-mail
- GENERAL OVERVIEW
- INSTITUTIONS AND ENERGY POLICY
- ENERGY COMPANIES
- ENERGY SUPPLY
- ENERGY PRICES
- ENERGY CONSUMPTION
- ISSUES AND PROSPECTS
- DATA TABLES
- ABBREVIATIONS
- GLOSSARY
Buy Portugal energy report
Price without VAT. Depending on your statute and location, VAT might be applicable. Get in touch with us for more information.
After validation, you will immediately receive 4 files by email (one pdf report and 3 excel files containing the datasets).
Overview
This analysis includes a comprehensive Portugal energy market report and updated datasets. It is derived from the most recent key economic indicators, supply and demand factors, oil and gas pricing trends and major energy issues and developments surrounding the energy industry. The report provides a complete picture of the country situation, dynamics, current issues and future prospects. With market data and continuous follow-up of markets news, this report brings clear and concise insights with which to tackle national energy challenges and opportunities. Browse the tabs below for a detailed table of contents, the list of graphs and tables, and details on the data files.
Highlights
- The country targets a reduction of 55% in GHG emissions and a 49% share of renewables in final energy consumption in 2030.
- EDP for electricity and Galp Energia for oil and gas dominate their respective markets.
- Chinese companies own 21% of EDP and 25% of REN, the power and gas transmission company.
- The share of renewables in the power mix declined by 4 points in 2022 to 61%, due to low hydropower production.
- Electricity and gas prices are around 20% below the EU average.
- The price of petroleum products has increased continually since 2020.
- Energy consumption per capita is almost a third lower than the EU average.
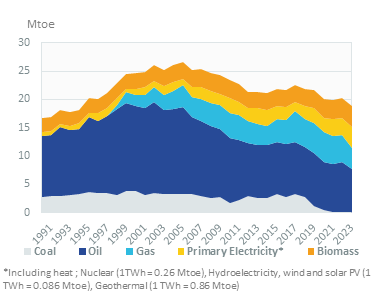
- The share of renewables in the energy mix has increased by 5 points since 2010 to 30% in 2022, while coal has disappeared in 2022.
- Portugal aims to strengthen its electricity grid to integrate more renewables (hydro and wind in the north and solar in the south).
- Portugal, Spain, France, and Germany aim to build a new underwater gas pipeline between Barcelona and Marseille as a future green H2 corridor.
Institutions & Energy Policy
The State Secretary for Energy and Climate, under the Ministry of Environment and Climate Action, oversees the national energy policy and supervises the energy sector. The Directorate General for Energy and Geology (DGEG) is responsible for designing, promoting, and evaluating energy policies.
ERSE, Entidade Reguladora dos Serviços Energéticos, is the electricity and gas regulator.
Energy Companies
Electricity:
EDP, Energias de Portugal, the former national electric utility, is partly controlled by foreign investors (CTG, China Three Gorges 21.08%, OPPIDUM 7.2%, BlackRock 7.19%, Canada Pension Plan Investment Board 5.92%).
Energy Supply
Resources:
Portugal does not have hydrocarbon resources. The country has hydroelectric potential of about 32 TWh. Its wind and solar potential is significant.
Energy Prices
Oil:
The price of petroleum products follows international oil prices. After a decline in 2020, gasoline and diesel prices have increased steadily (+15%/year for gasoline and +20%/year for diesel until 2022). Prices are slightly lower than the EU average (-3% for gasoline and -7% for diesel in 2022).
Graph: GASOLINE & DIESEL PRICES (€/l)
Energy Consumption
Consumption per capita is 28% lower than the EU average at 2.1 toe, 4 780 kWh of which is electricity (14% below the EU average) (2022).
Graph: CONSUMPTION TRENDS BY ENERGY SOURCE (Mtoe)
Issues & Prospects
Gas:
REN's draft Ten-Year Network Development and Investment Plan for 2024-2033 (PDIRG 2024-2033) estimates investments in the gas network at €162m over 2024-2033. REN expects gas consumption to decline by 3.7%/year between 2023 and 2033 to around 3.9 bcm, due to a 75% decrease in demand from the power sector.
- GRAPH 1: CO2-energy emissions (MtCO2)
- GRAPH 2: Installed electric capacity by source (2022, %)
- GRAPH 3: Gross power production by source (TWh)
- GRAPH 4: Power generation by source (2022, %)
- GRAPH 5: Gasoline & diesel prices (€/l)
- GRAPH 6: Electricity prices for industry and households (€c/kWh)
- GRAPH 7: Gas prices for industry and households (€c/kWh GCV)
- GRAPH 8: Consumption trends by energy source (Mtoe)
- GRAPH 9: TOTAL CONSUMPTION MARKET SHARE BY ENERGY (2022, %)
- GRAPH 10: Final consumption market share by sector (2022, %)
- GRAPH 11: Oil consumption (Mt)
- GRAPH 12: Oil consumption breakdown by sector (2022, %)
- GRAPH 13: Electricity consumption (TWh)
- GRAPH 14: Electricity consumption breakdown by sector (2022, %)
- GRAPH 15: Natural gas consumption (bcm)
- GRAPH 16: Gas consumption breakdown by sector (2022, %)
- GRAPH 17: Coal consumption (Mt)
- GRAPH 18: Coal consumption breakdown by sector (2022, %)
- Economic Indicators: Annual historical data including population, GDP growth, imports and exports, inflation rate, energy security and efficiency indicators, CO2 emissions.
- Supply Indicators: Historical data including oil and gas reserves, electric and refining capacity, energy production, power production and external trade. All are detailed by energy source.
- Demand Indicators: Historical data including consumption per inhabitant, consumption trends, total consumption by energy source, final consumption by energy source and sector, and electricity consumption by sector.
- Energy Balances: Single table displaying the overall energy industry balance per annum, also graphically displayed by energy sub-segment.
- Infrastructure Projects: Covers power plant projects by energy, technology, status and operator, gas plant projects by status and operator and LNG contracts.
The Portugal energy market data since 1990 and up to
is included in the Excel file accompanying the Portugal country report.
It showcases the historical evolution, allowing users to easily work with the data.
Key Data included in the excelsheet:
- Economic indicators: Annual historical economic indicators, energy security, energy efficiency and CO2 emissions.
- Supply indicators: Annual historical reserves, capacity, production and external trade (imports(+) exports(-) balance).
- Demand indicators: Annual historical consumption per capita, consumption trends, total consumption, final consumption (per energy and per sector) and electricity consumption total and per sector.
- Energy Balance: total and per energy.
- Portugal Energy Prices: In addition to the analysis provided on the report we also provided a data set which includes historical details on the Portugal energy prices for the follow items: price of premium gasoline (taxes incl.), price of diesel (taxes incl.), price of electricity in industry (taxes incl.), price of electricity for households (taxes incl.), price of natural gas in industry (taxes incl.), prices of natural gas for households (taxes incl.), spot price of Brent and CO2 emissions (from fuel combustion).
The Portugal country dashboards are complemented with country forecasts from EnerFuture (excel file) with scenario comparison.
Data included in the excelsheet:
- Demand: Primary energy consumption, final energy consumption, by fuel, by sector.
- Power: Electricity generation & capacities, by technology.
- CO2: Total CO2 emissions.
- Macro-economy: Main macro-economic assumptions.
- Key indicators: Energy intensity, share of renewables, CO2 emissions per capita and per unit of GDP.