
- Update
-
- Format
- 4 files (PDF report, 3 Excel files)
- Pages
-
50 (Report only)
- Delivery
- Immediate by e-mail
- GENERAL OVERVIEW
- INSTITUTIONS AND ENERGY POLICY
- ENERGY COMPANIES
- ENERGY SUPPLY
- ENERGY PRICES
- ENERGY CONSUMPTION
- ISSUES AND PROSPECTS
- DATA TABLES
- ABBREVIATIONS
- GLOSSARY
Buy Russia energy report
Price without VAT. Depending on your statute and location, VAT might be applicable. Get in touch with us for more information.
After validation, you will immediately receive 4 files by email (one pdf report and 3 excel files containing the datasets).
Overview
This analysis includes a comprehensive Russia energy market report and updated datasets. It is derived from the most recent key economic indicators, supply and demand factors, oil and gas pricing trends and major energy issues and developments surrounding the energy industry. The report provides a complete picture of the country situation, dynamics, current issues and future prospects. With market data and continuous follow-up of markets news, this report brings clear and concise insights with which to tackle national energy challenges and opportunities. Browse the tabs below for a detailed table of contents, the list of graphs and tables, and details on the data files.
Highlights
- Due to international sanctions, oil and gas revenues are expected to drop by roughly one-third in 2023.
- Russia aims to add 12 GW of renewables capacity and export between 2 to 7 Mt/year of hydrogen by 2035.
- Rushydro, Gazprom, and Inter Rao together own around 50% of the total power capacity.
- Gazprom dominates gas production with around 60% of the total.
- Rosneft is the main oil producer, with around half of total production.
- Western energy companies are leaving the country.
- Gas exports dropped by 31% in 2022 due to EU sanctions.
- Five nuclear reactors, totalling 5.5 GW, have been commissioned since 2017.
- Russia will cut its oil production by 3% until the end of 2023.
- Oil and electricity prices, and gas prices for households increased by around 15% in 2022.
- Natural gas prices for industries spiked by 35% in 2022.
- Over half of total energy consumption is supplied by gas (54% in 2022).
- Over half of the coal is consumed in the power sector.
- Power production should grow by 1.4%/year, reaching 1 400 TWh in 2035.
- Twelve nuclear reactors totalling 16.5 GW units are expected by 2030, of which two were in 2024.
- LNG production is slated to grow by 11%/year by 2035 to 140 Mt.
Institutions & Energy Policy
The Ministry of Energy is responsible for developing and implementing the country's energy policy.
Energy Companies
Oil:
Rosneft (Federal Government 40.4%, BP 19.75%, QH Oil Investment 18.46%) is the largest oil company, with a production of 5.1 mb/d (255 Mt in 2022 (+30%)), accounting for 47% of total oil production. In 2018, QH Oil Investment acquired 19% of Rosneft for US$4.25bn. In 2022, BP announced that it will exit its shareholding but still held its stake as of May 2023.
Energy Supply
Oil:
Crude oil production increased by 2% in 2022 to 540 Mt after a drop of around 8% in 2020, followed by a 2.5% rebound in 2021. Prior to that it had increased by 1.3%/year between 2014 and 2019. Russia is the world's second largest crude oil producer, after the USA, at the same level as Saudi Arabia.
Energy Prices
Oil:
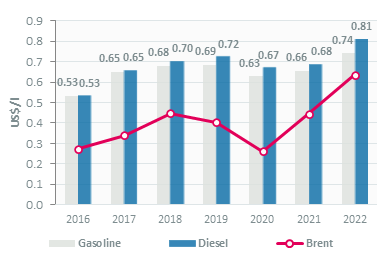
The Government liberalised the price of oil products. Diesel and gasoline prices increased to US$0.81/l and US$0.74/l in 2022 (+19% and +12%, respectively).
Graph: GASOLINE & DIESEL PRICES (US$/l)
Energy Consumption
Total per capita consumption reached 5.8 toe in 2022. Per capita electricity consumption was around 6 827 kWh.
Total energy consumption decreased by 1.2% in 2022 to 828 Mtoe, after a 9% rebound in 2021 and a 4% drop in 2020. It increased rapidly between 2015 and 2019 (2.8%/year).
Issues & Prospects
Gas:
According to the Energy Strategy for Russia, the production of natural gas should reach 885 bcm by 2035, mainly to meet the expected increase in domestic consumption.
- GRAPH 1: CO2-energy emissions (MtCO2)
- GRAPH 2: Installed electric capacity by source (2022, %)
- GRAPH 3: Gross power production by source (TWh)
- GRAPH 4: Power generation by source (2022, %)
- GRAPH 5: Gasoline & diesel prices (US$/l)
- GRAPH 6: Electricity prices for industry and households (US$c/kWh)
- GRAPH 7: Gas prices for industry and households (US$c/kWh GCV)
- GRAPH 8: Consumption trends by energy source (Mtoe)
- GRAPH 9: Total consumption market share by energy (2022, %)
- GRAPH 10: Final consumption market share by sector (2022, %)
- GRAPH 11: Oil consumption (Mt)
- GRAPH 12: Oil consumption breakdown by sector (2022, %)
- GRAPH 13: Electricity consumption (TWh)
- GRAPH 14: Electricity consumption breakdown by sector (2022, %)
- GRAPH 15: Natural gas consumption (bcm)
- GRAPH 16: Gas consumption breakdown by sector (2022, %)
- GRAPH 17: Coal consumption (Mt)
- GRAPH 18: Coal consumption breakdown by sector (2022, %)
- Economic Indicators: Annual historical data including population, GDP growth, imports and exports, inflation rate, energy security and efficiency indicators, CO2 emissions.
- Supply Indicators: Historical data including oil and gas reserves, electric and refining capacity, energy production, power production and external trade. All are detailed by energy source.
- Demand Indicators: Historical data including consumption per inhabitant, consumption trends, total consumption by energy source, final consumption by energy source and sector, and electricity consumption by sector.
- Energy Balances: Single table displaying the overall energy industry balance per annum, also graphically displayed by energy sub-segment.
- Infrastructure Projects: Covers power plant projects by energy, technology, status and operator, gas plant projects by status and operator and LNG contracts.
The Russia energy market data since 1990 and up to
is included in the Excel file accompanying the Russia country report.
It showcases the historical evolution, allowing users to easily work with the data.
Key Data included in the excelsheet:
- Economic indicators: Annual historical economic indicators, energy security, energy efficiency and CO2 emissions.
- Supply indicators: Annual historical reserves, capacity, production and external trade (imports(+) exports(-) balance).
- Demand indicators: Annual historical consumption per capita, consumption trends, total consumption, final consumption (per energy and per sector) and electricity consumption total and per sector.
- Energy Balance: total and per energy.
- Russia Energy Prices: In addition to the analysis provided on the report we also provided a data set which includes historical details on the Russia energy prices for the follow items: price of premium gasoline (taxes incl.), price of diesel (taxes incl.), price of electricity in industry (taxes incl.), price of electricity for households (taxes incl.), price of natural gas in industry (taxes incl.), prices of natural gas for households (taxes incl.), spot price of Brent and CO2 emissions (from fuel combustion).
The Russia country dashboards are complemented with country forecasts from EnerFuture (excel file) with scenario comparison.
Data included in the excelsheet:
- Demand: Primary energy consumption, final energy consumption, by fuel, by sector.
- Power: Electricity generation & capacities, by technology.
- CO2: Total CO2 emissions.
- Macro-economy: Main macro-economic assumptions.
- Key indicators: Energy intensity, share of renewables, CO2 emissions per capita and per unit of GDP.