
- Update
-
- Format
- 3 files (PDF report, 2 Excel files)
- Pages
-
29 (Report only)
- Delivery
- Immediate by e-mail
- GENERAL OVERVIEW
- INSTITUTIONS AND ENERGY POLICY
- ENERGY SUPPLY
- ENERGY PRICES
- ENERGY CONSUMPTION
- ISSUES AND PROSPECTS
- DATA TABLES
- ABBREVIATIONS
- GLOSSARY
Buy Uruguay energy report
Price without VAT. Depending on your statute and location, VAT might be applicable. Get in touch with us for more information.
After validation, you will immediately receive 3 files by email (one pdf report and 2 excel files containing the datasets).
Overview
This analysis includes a comprehensive Uruguay energy market report and updated datasets. It is derived from the most recent key economic indicators, supply and demand factors, oil and gas pricing trends and major energy issues and developments surrounding the energy industry. The report provides a complete picture of the country situation, dynamics, current issues and future prospects. With market data and continuous follow-up of markets news, this report brings clear and concise insights with which to tackle national energy challenges and opportunities. Browse the tabs below for a detailed table of contents, the list of graphs and tables, and details on the data files.
Highlights
- The country's energy policy aims to diversify the energy mix, to reduce reliance on oil and hydroelectricity, and to promote energy efficiency.
- UTE supplies around 60% of the country's electricity and controls transmission and distribution.
- Ancap is the main oil and gas company.
- Renewables represented 91% of the power mix in 2022.
- Excluding hydro, the share of renewables has increased by 43 points since 2010, reaching 53% in 2022.
- Energy prices are among the highest in South America.
- The share of biomass in total energy consumption has increased by 13 points since 2010, reaching 40% in 2022. It is mostly used in industry.
- Industry is the largest final energy consumer with 41%.
- A US$4bn hydrogen and synthetic fuel plant is under construction.
- A US$800m Conditional Credit line was approved by IDB to support the renovation of the Salto Grande hydropower plant.
Institutions & Energy Policy
The Ministry of Industry, Energy, and Mines (MIEM) oversees the energy sector through the National Energy Department (DNE). However, the Salto Grande hydroelectric plant, shared between Uruguay and Argentina, falls under the direct management of the Ministry of Foreign Relations.
Energy Supply
Oil:
Most of the oil imports consist of crude oil. The only refinery in the country, Teja, has a capacity of 50 kb/d. In 2022, the volume of crude oil processed reached 2 Mtoe. Oil came mostly from the USA (78%) and Nigeria (19%) Imports of oil products in 2022 were low (0.5 Mt of net imports).
Energy Prices
Oil:
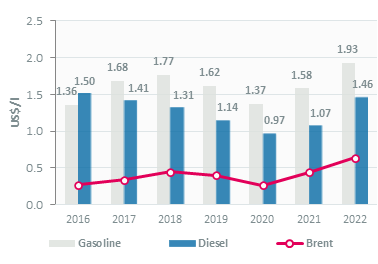
In 2022, the prices of unleaded gasoline and diesel followed international prices; they have increased by 40% and 50%, respectively, since 2020 to US$1. 93/l and US$1.46/l. These are among the highest in South America.
Graph: GASOLINE & DIESEL PRICES (US$/l)
Energy Consumption
The average primary energy consumption per capita stood at 1.6 toe in 2022, including around 3 400 kWh/cap of electricity.
Total energy consumption remained stable in 2022 (5.5 Mtoe), after strong growth in 2021 (+7%) and stability over 2018-2020.
Issues & Prospects
Gas:
The country expects to greatly exploit its gas reserves.
- GRAPH 1: CO2-energy Emissions (MtCO2)
- GRAPH 2: Installed electric capacity by source (2022, %)
- GRAPH 3: Gross power production by source (TWh)
- GRAPH 4: Power generation by source (2022, %)
- GRAPH 5: Electricity prices for industry and households (US$c/kWh)
- GRAPH 6: Gasoline & diesel prices (US$/l)
- GRAPH 7: Gas prices for industry and households (US$c/kWh GCV)
- GRAPH 8: Consumption trends by energy source (Mtoe)
- GRAPH 9: Total consumption market share by energy (2022, %)
- GRAPH 10: Final consumption market share by sector (2022, %)
- Economic Indicators: Annual historical data including population, GDP growth, imports and exports, inflation rate, energy security and efficiency indicators, CO2 emissions.
- Supply Indicators: Historical data including oil and gas reserves, electric and refining capacity, energy production, power production and external trade. All are detailed by energy source.
- Demand Indicators: Historical data including consumption per inhabitant, consumption trends, total consumption by energy source, final consumption by energy source and sector, and electricity consumption by sector.
- Energy Balances: Single table displaying the overall energy industry balance per annum, also graphically displayed by energy sub-segment.
- Infrastructure Projects: Covers power plant projects by energy, technology, status and operator.
The Uruguay energy market data since 1990 and up to
is included in the Excel file accompanying the Uruguay country report.
It showcases the historical evolution, allowing users to easily work with the data.
Key Data included in the excelsheet:
- Economic indicators: Annual historical economic indicators, energy security, energy efficiency and CO2 emissions.
- Supply indicators: Annual historical reserves, capacity, production and external trade (imports(+) exports(-) balance).
- Demand indicators: Annual historical consumption per capita, consumption trends, total consumption, final consumption (per energy and per sector) and electricity consumption total and per sector.
- Energy Balance: total and per energy.
- Uruguay Energy Prices: In addition to the analysis provided on the report we also provided a data set which includes historical details on the Uruguay energy prices for the follow items: price of premium gasoline (taxes incl.), price of diesel (taxes incl.), price of electricity in industry (taxes incl.), price of electricity for households (taxes incl.), price of natural gas in industry (taxes incl.), prices of natural gas for households (taxes incl.), spot price of Brent and CO2 emissions (from fuel combustion).