Greece Key Figures
- Population:
- 10.4 million
- GDP growth rate:
- 2.01 %/year
- Energy independence:
- 24.1%
Data of the last year available: 2023
- Total consumption/GDP:*
- 71.2 (2005=100)
- CO2 Emissions:
- 4.47 tCO2/capita
- Rate of T&D power losses:
- 8.15%
* at purchasing power parity
View all macro and energy indicators in the Greece energy report
Greece Energy News
View all news, archive your new and create your own daily newsletters only on your topics/countries of interest with Key Energy Intelligence
Greece Energy Research
Benefit from up to 2 000 up-to-date data series for 186 countries in Global Energy & CO2 data
A data overview is available in the global energy statistics app
Greece Total Energy Consumption
Total energy consumption per capita is 1.8 toe in 2023 (34% below the EU average), including around 4 700 kWh of electricity (13% below the EU average).
Graph: CONSUMPTION TRENDS BY ENERGY SOURCE (Mtoe)
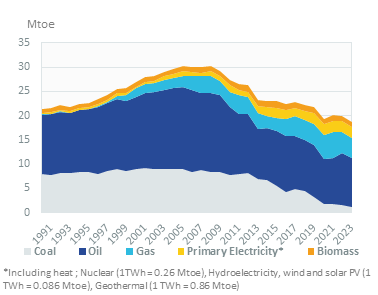
Total energy consumption has been declining by 3%/year since 2008 to 19 Mtoe in 2023 (-5.5% in 2023 alone, after two years of stability at around 20 Mtoe).
Interactive Chart Greece Total Energy Consumption
Benefit from up to 2 000 up-to-date data series for 186 countries in Global Energy & CO2 data
View the detailed fondamentals of the market at country level (graphs, tables, analysis) in the Greece energy report
Greece Crude Oil Production
All crude oil is imported (27 Mt in 2023). The main suppliers are Iraq (40% in 2023), Kazakhstan (22%), and Libya (14%). Until 2021, Russia was one of the top three exporters to Greece, but imports fell by 76% in 2022 (0 in 2023).
Interactive Chart Greece Crude Oil Production
Benefit from up to 2 000 up-to-date data series for 186 countries in Global Energy & CO2 data
Additionally, for more detailed information on refineries, you can request a sample of our EMEA Refineries Dataset
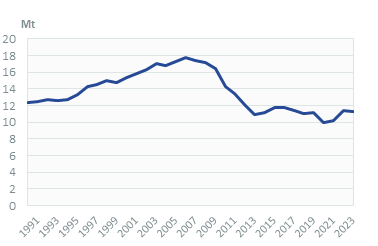
Greece Oil Products Consumption
The consumption of oil products increased by 11% in 2022 to around 11 Mt in 2022 and remained stable in 2023. It had increased regularly from 1990 until a peak at 18 Mt in 2006 (close to 2%/year on average), before falling by 36% between 2008 and 2013 because of the economic crisis.
Graph: OIL CONSUMPTION (Mt)
Interactive Chart Greece Refined Oil Products Production
Benefit from up to 2 000 up-to-date data series for 186 countries in Global Energy & CO2 data
Additionally, for more detailed information on refineries, you can request a sample of our EMEA Refineries Dataset
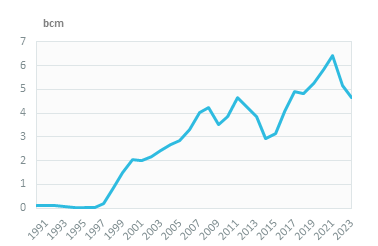
Greece Natural Gas Consumption
Natural gas consumption decreased by almost 10% in 2023 to 4.7 bcm, after a rapid rise from 2015 to 2021. It increased strongly between its introduction in 1997 and 2011 and subsequently fell until 2014 due to the economic crisis and the decrease in power generation.
The electricity sector absorbs 66% of the total gas consumption, industry (including non-energy uses) 15%, and buildings 17%.
Graph: NATURAL GAS CONSUMPTION (bcm)
Interactive Chart Greece Natural Gas Domestic Consumption
Benefit from up to 2 000 up-to-date data series for 186 countries in Global Energy & CO2 data
Additionally, for more detailed information on the LNG trade, you can request a sample of our EMEA LNG Trade Dataset
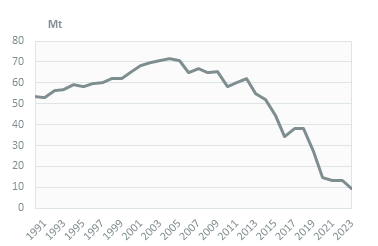
Greece Coal Consumption
Lignite consumption reached an all-time high in 2004 (72 Mt) and has been falling since then to 9.5 Mt in 2023 (-28% in 2023 alone). Nearly all the lignite consumption is used by the electricity sector and the current decrease in demand is explained by changes in the power mix (rising gas-fired and renewable generation) and the closure of the last lignite-fired power units.
Graph: COAL CONSUMPTION (Mt)
Graph: COAL CONSUMPTION BREAKDOWN BY SECTOR (2023, %)
Interactive Chart Greece Coal and Lignite Domestic Consumption
Benefit from up to 2 000 up-to-date data series for 186 countries in Global Energy & CO2 data
View the detailed consumption trends at country level (graphs, tables, analysis) in the Greece energy report
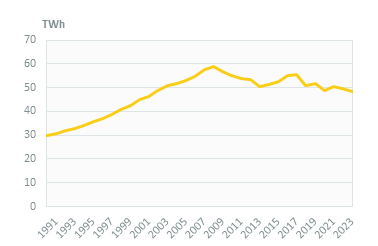
Greece Power Consumption
Electricity consumption decreased by 2.3% to 48.3 TWh in 2023. It has been generally decreasing since a peak at 59 TWh in 2008.
Households and services are the largest consumers of electricity (34% and 35%, respectively), followed by industry (24%).
Graph: ELECTRICITY CONSUMPTION (TWh)
Graph: ELECTRICITY CONSUMPTION BREAKDOWN BY SECTOR (2023, %)
Greece Renewable in % Electricity Production
The national target, according to the EU Directive on renewables, of 18% of renewables in the final energy consumption in 2020 has been exceeded by almost 4 pp (21.7% in 2020).
Under its revised NECP (2024), Greece aims to raise the share of renewables in final energy consumption to 67% of by 2030, including 81% for electricity (up from 66% in the 2019 NECP) and 14% in transport. In 2022, the share of renewables in final energy consumption reached 22.7%, including 42.4% for electricity,.30.6% in heating and cooling and 4.1% in transport.
Interactive Chart Greece Share of Renewables in Electricity Production (incl hydro)
Benefit from up to 2 000 up-to-date data series for 186 countries in Global Energy & CO2 data
Learn more about renewables in the European Battery Market Analysis
Greece CO2 Fuel Combustion/CO2 Emissions
Total net GHG emissions remained rather stable in 2022 at 72.9 MtCO2eq. They nearly halved between their 2007 peak and 2020 (of which -13% in 2020), following the economic recession. In 2022, they were 28% below their 1990 level.
The revised NECP (2024) aims to cut net GHG emissions (including LULUCF) by over 58% by 2030 (compared to 1990 level), to 43.2 MtCO2eq in 2030 and to zero in 2050, thanks to a sharp reduction in emissions from power generation and transport, increased LULUCF removals and the use of direct air capture to store CO2.