India Key Figures
- Population:
- 1417 million
- GDP growth rate:
- 7.00 %/year
- Energy independence:
- 65.7%
Data of the last year available: 2022
- Total consumption/GDP:*
- 75.7 (2005=100)
- CO2 Emissions:
- 1.72 tCO2/capita
- Rate of T&D power losses:
- 19.3%
* at purchasing power parity
View all macro and energy indicators in the India energy report
India Related News
View all news, archive your new and create your own daily newsletters only on your topics/countries of interest with Key Energy Intelligence
India Related Research
Benefit from up to 2 000 up-to-date data series for 186 countries in Global Energy & CO2 data
A data overview is available in the global energy statistics app
Total Energy Consumption
Total energy consumption per capita remains around 0.7 toe (2022), half the Asian average. Electricity consumption per capita reached 930 kWh in 2022, about a third of the Asian average.
Total energy consumption continued to grow very rapidly (8% in 2021 and 6.5% in 2022) and exceeded 1 Gtoe in 2022 for the first time. It had increased rapidly over 2010-2022 (3.5%/year).
Coal is the country's top energy source with a share of 46% in 2022, followed by oil (24%) and biomass (21%). Natural gas covers 5% and primary electricity (hydro, nuclear, solar, and wind) 4%.
Interactive Chart India Total Energy Consumption
Benefit from up to 2 000 up-to-date data series for 186 countries in Global Energy & CO2 data
View the detailed fondamentals of the market at country level (graphs, tables, analysis) in the India energy report
Crude Oil Production
Oil production has been declining since 2010, reaching 33 Mt in 2022 (-11% since 2019).
India is the world's third largest importer of crude oil, reaching its highest level in 2022 at 232 Mt (+9.6%). In 2022, crude oil imports represented 88% of the country's oil needs. The country is a net oil product exporter (17 Mt in 2022), although its net exports have fallen by 42% since 2018.
Interactive Chart India Crude Oil Production
Benefit from up to 2 000 up-to-date data series for 186 countries in Global Energy & CO2 data
Additionally, for more detailed information on refineries, you can request a sample of our Asia Refineries Dataset
Oil Products Consumption
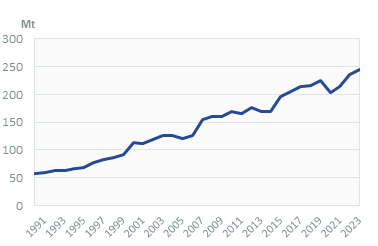
Oil product consumption has rebounded since 2020 (7.5%/year) after a sharp drop in 2020 (-13%) and reached 233 Mt in 2022. It had increased rapidly over 2010-2019 (4.4%/year).
Of the total consumption for 2022, 44% was used in transport, 29% in industry (including non-energy uses), and 20% in the residential, services, and agriculture sector.
Graph: OIL CONSUMPTION (Mt)
Graph: OIL CONSUMPTION BREAKDOWN BY SECTOR (2022, %)
Interactive Chart India Refined Oil Products Production
Benefit from up to 2 000 up-to-date data series for 186 countries in Global Energy & CO2 data
Additionally, for more detailed information on refineries, you can request a sample of our Asia Refineries Dataset
Natural Gas Consumption
Gas consumption fell by 6% to 60 bcm in 2022, below 2017 levels, as high gas prices deterred imports. It increased by 2.8% in 2021, after a 3.7% drop in 2020. Between 2014 and 2019, gas consumption increased by 4.8%/year.
Industry is the main consumer of gas with 55% in 2022 (mainly fertiliser plants). It is followed by electricity production (18%) and, to a much lesser extent, the residential and services sector (8%) and transport (7%).
India aims to promote the use of CNG vehicles to reduce pollution in cities; 5 900 CNG stations had been deployed as of July 2023.
Interactive Chart India Natural Gas Domestic Consumption
Benefit from up to 2 000 up-to-date data series for 186 countries in Global Energy & CO2 data
Additionally, for more detailed information on the LNG trade, you can request a sample of our Asia LNG Trade Dataset
Coal Consumption
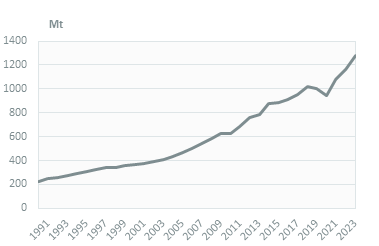
Coal and lignite consumption reached 1.15 Gt (+8.6%), its highest level, in 2022. Between 2015 and 2018, its progression had been significant (around 5%/year). It decreased in 2019 and 2020 and rebounded in 2021.
In 2022, power generation and industry were the main consumers of coal and lignite, with 75% and 21%, respectively (3% only for households and services).
Graph: COAL CONSUMPTION (Mt)
Graph: COAL CONSUMPTION BREAKDOWN BY SECTOR (2022, %)
Interactive Chart India Coal and Lignite Domestic Consumption
Benefit from up to 2 000 up-to-date data series for 186 countries in Global Energy & CO2 data
View the detailed consumption trends at country level (graphs, tables, analysis) in the India energy report
Power Consumption
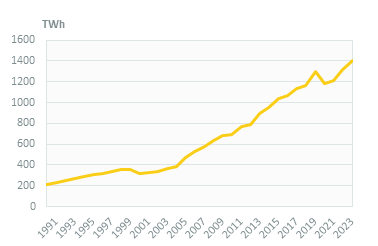
Electricity consumption increased by 9% in 2022 to 1320 TWh, after a 4% progression in 2021. It grew rapidly over 2010-2019 (7%/year) and fell by 6.7% in 2020.
Graph: ELECTRICITY CONSUMPTION (TWh)
Renewable in % Electricity Production
IREDA, the Indian Renewable Energy Development Agency,finances the development of renewables.
SECI, Solar Energy Corporation of India, under the MNRE, manages the implementation of the Jawaharlal Nehru National Solar Mission (JNNSM). The Solar Mission (JNNSM) aimed to deploy 100 GW of solar power over 2010-2022 (63 GW achieved). The government also set the target of 40 GW of rooftop solar capacity by mid-2022 (only 8.8 GW installed at the end of 2022).
Interactive Chart India Share of Renewables in Electricity Production (incl hydro)
Benefit from up to 2 000 up-to-date data series for 186 countries in Global Energy & CO2 data
Learn more about renewables in the Mini grid Africa & Asia markets for village electrification
CO2 Fuel Combustion/CO2 Emissions
In its updated NDC (2022), the country reiterated a target to reduce its CO2 emission intensity of GDP by 45% in 2030, compared to 2005 levels. It also aims for 50% of the total electricity capacity to be based on non-fossil fuel sources in 2030 (the previous target was 40%) from 36% in 2022. It is also considering implementing a carbon market. The BEE released draft rules for the country's planned compliance carbon market in November 2023.
In 2021, the country pledged to reach net-zero emissions in 2070.