Netherlands Key Figures
- Population:
- 17.6 million
- GDP growth rate:
- 4.52 %/year
- Energy independence:
- 38.9%
Data of the last year available: 2022
- Total consumption/GDP:*
- 61.6 (2005=100)
- CO2 Emissions:
- 7.94 tCO2/capita
- Rate of T&D power losses:
- 4.21%
* at purchasing power parity
View all macro and energy indicators in the Netherlands energy report
Netherlands Related News
View all news, archive your new and create your own daily newsletters only on your topics/countries of interest with Key Energy Intelligence
Netherlands Related Research
Benefit from up to 2 000 up-to-date data series for 186 countries in Global Energy & CO2 data
A data overview is available in the global energy statistics app
Total Energy Consumption
Energy consumption per capita reached 3.6 toe in 2022 and is around 22% higher than the EU average, mainly because of the large refining and petrochemical industries. Per capita electricity consumption is 6 129 kWh, which is 10% above the EU average.
Total energy consumption decreased by 12% in 2022 to 63 Mtoe, after experiencing a 3% post-Covid rebound in 2021. Total consumption experienced a 1.7%/year decrease (at normal climate) between 2017 and 2020. In 2022, the consumption was 26% lower than its peak at 82 Mtoe in 2010.
Interactive Chart Netherlands Total Energy Consumption
Benefit from up to 2 000 up-to-date data series for 186 countries in Global Energy & CO2 data
View the detailed fondamentals of the market at country level (graphs, tables, analysis) in the Netherlands energy report
Crude Oil Production
Crude oil production is low (less than 1 Mt in 2022). Crude imports (63 Mt in 2021) mainly came from Russia and the UK (25% and 16% in 2021, respectively).
The country plays a major role in Europe's oil supply, both in terms of exported volumes, as well as in terms of fixing the oil price (spot market of Rotterdam). In addition, the port of Rotterdam is a key location for oil transit in Europe.
Interactive Chart Netherlands Crude Oil Production
Benefit from up to 2 000 up-to-date data series for 186 countries in Global Energy & CO2 data
Additionally, for more detailed information on refineries, you can request a sample of our EMEA Refineries Dataset
Oil Products Consumption
Oil consumption decreased by 4% in 2022 to 23.8 Mt, after a small increase in 2021 (+1.2%). Previously, it decreased by 1.6%/year on average between 2010 and 2020.
Graph: OIL CONSUMPTION (Mt)
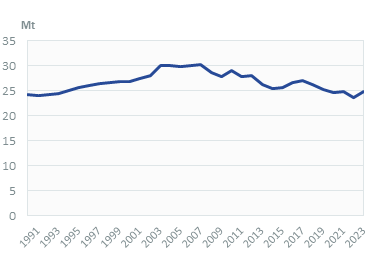
The largest share of oil is consumed for non-energy uses in the petrochemical industry (35%), followed by transport (33%).
Graph: OIL CONSUMPTION BREAKDOWN BY SECTOR (2022, %)
Interactive Chart Netherlands Refined Oil Products Production
Benefit from up to 2 000 up-to-date data series for 186 countries in Global Energy & CO2 data
Additionally, for more detailed information on refineries, you can request a sample of our EMEA Refineries Dataset
Natural Gas Consumption
Gas consumption dropped by 22% in 2022 to 33 bcm. It had declined by 3%/year between 2019 and 2021 to 42 bcm after increasing by 2%/year on average over 2015-2019.
Graph: NATURAL GAS CONSUMPTION (bcm)
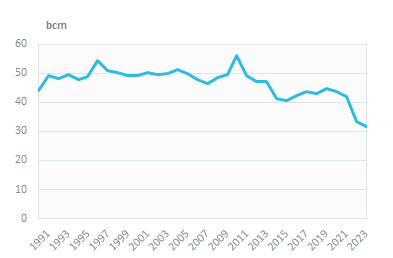
The residential and services sector accounts for 38% of the natural gas consumption (2022). Almost all households use gas for heating, water heating, and cooking (98%). Electricity production represented 32% of gas consumption, while industry accounted for 24%.
Interactive Chart Netherlands Natural Gas Domestic Consumption
Benefit from up to 2 000 up-to-date data series for 186 countries in Global Energy & CO2 data
Additionally, for more detailed information on the LNG trade, you can request a sample of our EMEA LNG Trade Dataset
Coal Consumption
Coal is mainly consumed for power generation (63%), followed by industry (28%). In 2021, coal consumption increased by 43% and remained stable in 2022 at around 9 Mt. Between 2015 and 2020, coal consumption dropped by 67% (37% of which in 2020) to 6 Mt, due to the closures of coal-fired power plants. Previously, coal consumption saw a strong progression between 2011 and 2015 thanks to the gas-to-coal switch (+50%, including a 22% surge in 2015), bringing it to 18 Mt.
Graph: COAL CONSUMPTION (Mt)
Interactive Chart Netherlands Coal and Lignite Domestic Consumption
Benefit from up to 2 000 up-to-date data series for 186 countries in Global Energy & CO2 data
View the detailed consumption trends at country level (graphs, tables, analysis) in the Netherlands energy report
Power Consumption
Electricity consumption decreased by 3.7% in 2022 to 108 TWh, after experiencing a slight increase in 2021 (+1%). Previously, it had remained relatively stable over 2018-2020, after progressing by 1.2% per year between 2015 and 2018 and decreasing slightly over 2009-2014 (-0.8%/year).
Graph: ELECTRICITY CONSUMPTION (TWh)
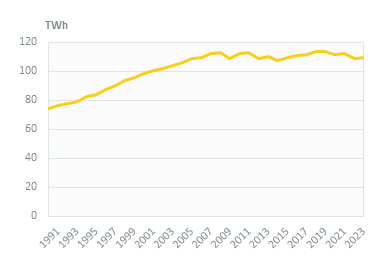
The services sector and industry are the largest electricity users (32% each in 2022), followed by the residential sector (20%).
Renewable in % Electricity Production
EZK is in charge of renewable energy policy, including the Stimulation of Sustainable Energy Production (SDE++ since 2020, Stimulering Duurzame Energieproductie) programme.
The national target to increase the share of renewables in final consumption to 14% in 2020 was reached thanks to imports of renewable electricity from Denmark.
Interactive Chart Netherlands Share of Renewables in Electricity Production (incl hydro)
Benefit from up to 2 000 up-to-date data series for 186 countries in Global Energy & CO2 data
Learn more about renewables in the European Battery Market Analysis
CO2 Fuel Combustion/CO2 Emissions
Total net GHG emissions (including international aviation) have been decreasing since a peak in 1996. They reached nearly 172 Mt CO2eq in 2021, around 28% below their 1990 level and 36% below their peak value. They dropped by 11% in 2020 with the Covid crisis before increasing by close to 2% in 2021. According to preliminary data, emissions fell by 9% in 2022 to around 152 MtCO2eq, mainly due to reduced gas consumption.