Norway Key Figures
- Population:
- 5.46 million
- GDP growth rate:
- 3.28 %/year
- Energy independence:
- 100%
Data of the last year available: 2022
- Total consumption/GDP:*
- 73.6 (2005=100)
- CO2 Emissions:
- 6.57 tCO2/capita
- Rate of T&D power losses:
- 6.92%
* at purchasing power parity
View all macro and energy indicators in the Norway energy report
Norway Related News
View all news, archive your new and create your own daily newsletters only on your topics/countries of interest with Key Energy Intelligence
Norway Related Research
Benefit from up to 2 000 up-to-date data series for 186 countries in Global Energy & CO2 data
A data overview is available in the global energy statistics app
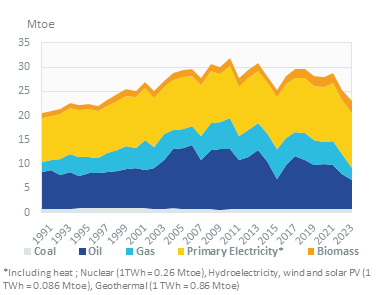
Total Energy Consumption
Total energy consumption per capita reached 5.1 toe in 2022, almost double the EU average. This was driven by an electricity consumption per capita that is over four times the EU average and the highest in the world, at 22 500 kWh.
The country's total energy consumption decreased by 4.4% in 2022 to 28 Mtoe. It has ranged between 26 Mtoe and 31 Mtoe since 2010.
Graph: CONSUMPTION TRENDS BY ENERGY SOURCE (Mtoe)
Interactive Chart Norway Total Energy Consumption
Benefit from up to 2 000 up-to-date data series for 186 countries in Global Energy & CO2 data
View the detailed fondamentals of the market at country level (graphs, tables, analysis) in the Norway energy report
Crude Oil Production
Oil and NGL production increased significantly in 2020 (+18%) with the start of operations at the Johan Sverdrup field in 2019; it then rose by 2% in 2021 (+2%) but declined by 4% to 91 Mt in 2022. Between 2016 and 2019, production declined by 8%. However, in 2022, oil production decreased. Production reached a peak of 163 Mt in 2001. Over the last 50 years, about half of the estimated total recoverable resources on the continental shelf have been produced.
Interactive Chart Norway Crude Oil Production
Benefit from up to 2 000 up-to-date data series for 186 countries in Global Energy & CO2 data
Additionally, for more detailed information on refineries, you can request a sample of our EMEA Refineries Dataset
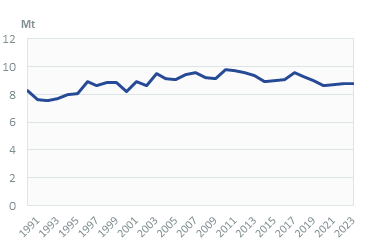
Oil Products Consumption
Oil product consumption has been declining by 3.2%/year since 2017, reaching 8.2 Mt in 2022.
Graph: OIL CONSUMPTION (Mt)
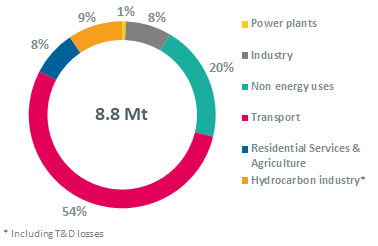
Transport represents 53 of the total oil consumption, non-energy uses 20%, the hydrocarbon sector 9%, and industry 9% (2022).
Graph: OIL CONSUMPTION BREAKDOWN BY SECTOR (2022, %)
Interactive Chart Norway Refined Oil Products Production
Benefit from up to 2 000 up-to-date data series for 186 countries in Global Energy & CO2 data
Additionally, for more detailed information on refineries, you can request a sample of our EMEA Refineries Dataset
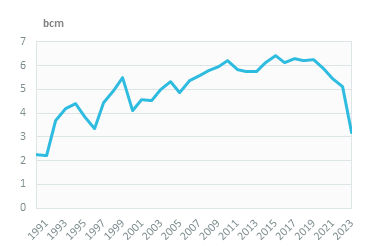
Natural Gas Consumption
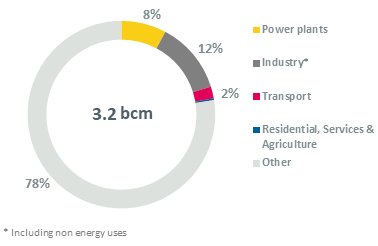
Natural gas consumption has surged since 2020, rising by 11% in 2021 and by 26% in 2022 to 7 bcm. It ranged before between 5 and 7 bcm between 2010 and 2020.
Graph: NATURAL GAS CONSUMPTION (bcm)
Over 80% of gas is used in the hydrocarbon sector (85% in 2022).
Graph: GAS CONSUMPTION BREAKDOWN BY SECTOR (2022, %)
Interactive Chart Norway Natural Gas Domestic Consumption
Benefit from up to 2 000 up-to-date data series for 186 countries in Global Energy & CO2 data
Additionally, for more detailed information on the LNG trade, you can request a sample of our EMEA LNG Trade Dataset
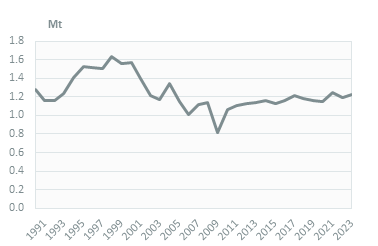
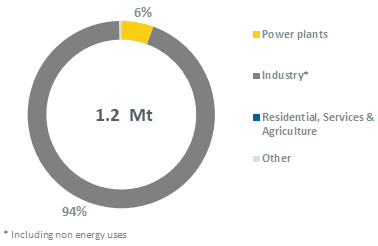
Coal Consumption
Coal consumption is relatively low and has remained roughly stable since 2010, at 1-1.2 Mt/year. Coal is mainly used in the metallurgical industry, that represents more than 90% of the demand (94% in 2022).
Graph: COAL CONSUMPTION (Mt)
Graph: COAL CONSUMPTION BREAKDOWN BY SECTOR (2022, %)
Interactive Chart Norway Coal and Lignite Domestic Consumption
Benefit from up to 2 000 up-to-date data series for 186 countries in Global Energy & CO2 data
View the detailed consumption trends at country level (graphs, tables, analysis) in the Norway energy report
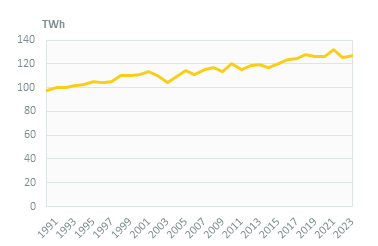
Power Consumption
Electricity consumption fell by 5% to 123 TWh in 2022, after growth of 0.7%/year over 2010-2021. In 2022, the consumption of households dropped by 13%, because of higher prices and a warmer climate (most households use electricity for space heating).
Graph: ELECTRICITY CONSUMPTION (TWh)
Renewable in % Electricity Production
Norway and Sweden have a common green certificate market since 2012 with the target of raising electricity generation from renewables by 28.4 TWh (equally divided between the countries) over 2012-2020. This renewable obligation contributes to the combined target of 40 TWh of renewables and energy savings in 2020. In late 2020, Sweden announced plans to add another 18 TWh of new renewable power by 2022 under the common green subsidy scheme. The program was closed to new participants in January 2022 and the system should close in 2035.
Interactive Chart Norway Share of Renewables in Electricity Production (incl hydro)
Benefit from up to 2 000 up-to-date data series for 186 countries in Global Energy & CO2 data
Learn more about renewables in the European Battery Market Analysis
CO2 Fuel Combustion/CO2 Emissions
In its updated NDC (2022), Norway increased its 2030 GHG emission reduction target from 50% to at least 55% from a 1990 baseline; the target doesn't include land use, land-use change and forestry (LULUCF), and puts Norway in line with the EU's goals of cutting emissions by 55% between 1990 and 2030. Consequently, Norway's GHG emissions should reach 23 MtCO2eq in 2030.