Russia Key Figures
- Population:
- 144 million
- GDP growth rate:
- -2.1 %/year
- Energy independence:
- 100%
Data of the last year available: 2022
- Total consumption/GDP:*
- 90.6 (2005=100)
- CO2 Emissions:
- 12.3 tCO2/capita
- Rate of T&D power losses:
- 9.21%
* at purchasing power parity
View all macro and energy indicators in the Russia energy report
Russia Related News
View all news, archive your new and create your own daily newsletters only on your topics/countries of interest with Key Energy Intelligence
Russia Related Research
Benefit from up to 2 000 up-to-date data series for 186 countries in Global Energy & CO2 data
A data overview is available in the global energy statistics app
Total Energy Consumption
Total per capita consumption reached 5.8 toe in 2022. Per capita electricity consumption was around 6 827 kWh.
Total energy consumption decreased by 1.2% in 2022 to 828 Mtoe, after a 9% rebound in 2021 and a 4% drop in 2020. It increased rapidly between 2015 and 2019 (2.8%/year).
In 2022, gas represented the largest share of consumption (54%), followed by oil (19%), coal (17%), nuclear (7%), hydro (2%), and biomass (1%).
Graph: CONSUMPTION TRENDS BY ENERGY SOURCE (Mtoe)
Interactive Chart Russia Total Energy Consumption
Benefit from up to 2 000 up-to-date data series for 186 countries in Global Energy & CO2 data
View the detailed fondamentals of the market at country level (graphs, tables, analysis) in the Russia energy report
Crude Oil Production
Crude oil production increased by 2% in 2022 to 540 Mt after a drop of around 8% in 2020, followed by a 2.5% rebound in 2021. Prior to that it had increased by 1.3%/year between 2014 and 2019. Russia is the world's second largest crude oil producer, after the USA, at the same level as Saudi Arabia.
Interactive Chart Russia Crude Oil Production
Benefit from up to 2 000 up-to-date data series for 186 countries in Global Energy & CO2 data
Additionally, for more detailed information on refineries, you can request a sample of our EMEA Refineries Dataset
Oil Products Consumption
Oil consumption decreased by 1.3% in 2022 to 161 Mt. It had previously rebounded by 5% in 2021 after dropping by around 4% in 2020. It remained roughly stable between 2012 and 2019 at about 150 Mtoe.
Graph: OIL CONSUMPTION (Mt)
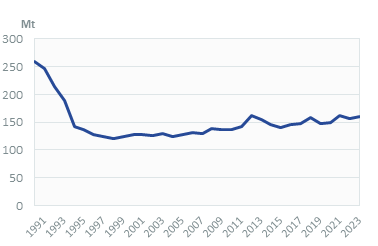
Transport is the largest oil consuming sector with 40% of total oil products, ahead of industry (32%, including non-energy uses), the hydrocarbon sector (14%), and the residential-services-agriculture sector (12%).
Interactive Chart Russia Refined Oil Products Production
Benefit from up to 2 000 up-to-date data series for 186 countries in Global Energy & CO2 data
Additionally, for more detailed information on refineries, you can request a sample of our EMEA Refineries Dataset
Natural Gas Consumption
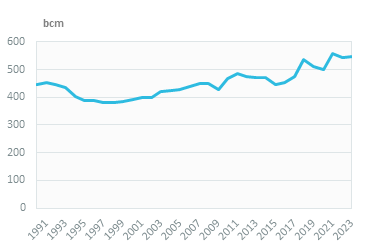
Gas consumption decreased by around 3.1% in 2022, reaching 539 bcm. In 2021, it rebounded by 12% after dropping by 2% in 2020. It grew by around 5%/year between 2016 and 2019.
Gas is mainly consumed in the electricity sector (39%). Industry represents 17% and the residential-services sector 16%.
Graph: NATURAL GAS CONSUMPTION (bcm)
Graph: GAS CONSUMPTION BREAKDOWN BY SECTOR (2022, %)
Interactive Chart Russia Natural Gas Domestic Consumption
Benefit from up to 2 000 up-to-date data series for 186 countries in Global Energy & CO2 data
Additionally, for more detailed information on the LNG trade, you can request a sample of our EMEA LNG Trade Dataset
Coal Consumption
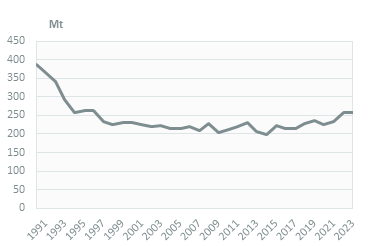
Coal and lignite consumption has increased by 4.8%/year since 2020, reaching 247 Mt in 2022. It increased by 3.4%/year between 2014 and 2019 and dropped by almost 11% in 2020.
More than half of the coal and lignite is consumed in power plants (53% in 2022) and 24% is used in industry.
Graph: COAL CONSUMPTION (Mt)
Graph: COAL CONSUMPTION BREAKDOWN BY SECTOR (2022, %)
Interactive Chart Russia Coal and Lignite Domestic Consumption
Benefit from up to 2 000 up-to-date data series for 186 countries in Global Energy & CO2 data
View the detailed consumption trends at country level (graphs, tables, analysis) in the Russia energy report
Power Consumption
Total electricity consumption has increased by 3.6%/year since 2020 (including a 5% spike in 2021), reaching 980 TWh in 2022. It increased slightly between 2010 and 2019 (1%/year).
Industry is the main electricity consumer with 38% of the total (-7 points since 2000), ahead of the residential sector with 18% (20% in 2000) and services with 17% (nearly doubling since 2000). Transport accounts for 6% of total electricity consumption, i.e. a significant share compared to other countries, due to the strong presence of public transport.
Graph: ELECTRICITY CONSUMPTION (TWh)
Renewable in % Electricity Production
The Government target for 2020 of a 2.5% share of wind and solar in the power mix (State Programme on Energy Efficiency and Energy Development, 2014) has not been reached (0.3% in 2020). In 2021, the authorities announced plans to award RUB 360bn (US$4.9bn) of state support for renewable projects through 2035, with the aim of adding 12 GW of renewables by 2035. In 2021, the Ministry of Energy announced that it will seek to increase the share of renewables to 31.5% of the power mix by 2050 (of which 19% from hydropower, and 12.5% from wind and solar).
Interactive Chart Russia Share of Renewables in Electricity Production (incl hydro)
Benefit from up to 2 000 up-to-date data series for 186 countries in Global Energy & CO2 data
CO2 Fuel Combustion/CO2 Emissions
Inits first NDC (2020), the country set the target to cut GHG emissions to 70% of their 1990 level in 2030 to 2.2 GtCO2eq, taking into account the maximum possible absorptive capacity of forests.
In 2021, the parliament approved a law on climate change that will oblige large emitters to report their emissions to regulators. The measure concerns companies that emit over 150 MtCO2/year before 2024 and more than 50 MtCO2/year after 2024. This bill is a first step to create legislation that will allow the regulation of CO2 emissions.