United Kingdom Key Figures
- Population:
- 67.0 million
- GDP growth rate:
- 4.10 %/year
- Energy independence:
- 67.2%
Data of the last year available: 2022
- Total consumption/GDP:*
- 56.5 (2005=100)
- CO2 Emissions:
- 4.70 tCO2/capita
- Rate of T&D power losses:
- 8.09%
* at purchasing power parity
View all macro and energy indicators in the United Kingdom energy report
United Kingdom Related News
View all news, archive your new and create your own daily newsletters only on your topics/countries of interest with Key Energy Intelligence
United Kingdom Related Research
Benefit from up to 2 000 up-to-date data series for 186 countries in Global Energy & CO2 data
A data overview is available in the global energy statistics app
Total Energy Consumption
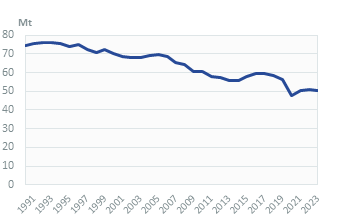
Consumption per capita has shrunk by almost a third since 2000, bringing it to 2.3 toe in 2022. Electricity consumption per capita dropped by more than 20%, from 5 800 kWh in 2000 to 4 200 kWh in 2022.
In 2022, energy consumption at normal climate decreased by almost 5% to 153 Mtoe, after a 3% increase in 2021. In 2020, consumption dropped by 8%. Previously, between 2003 and 2019, energy consumption at normal climate decreased by almost 2%/year.
Graph: CONSUMPTION TRENDS BY ENERGY SOURCE (Mtoe)
Interactive Chart United Kingdom Total Energy Consumption
Benefit from up to 2 000 up-to-date data series for 186 countries in Global Energy & CO2 data
View the detailed fondamentals of the market at country level (graphs, tables, analysis) in the United Kingdom energy report
Crude Oil Production
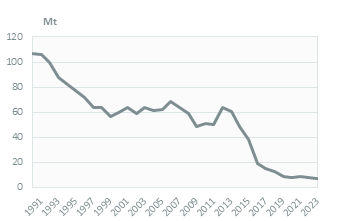
Since 2019, crude oil production has declined by more than 10%/year, reaching 38 Mt in 2022. Previously, it rebounded by 5.5%/year between 2014 and 2019 from 40 Mt to 53 Mt. Over 1999-2014, oil production decreased by 8%/year from a peak of 137 Mt to 40 Mt.
The UK became a net crude oil importer in 2005 (15 Mt of net imports in 2022).
Interactive Chart United Kingdom Crude Oil Production
Benefit from up to 2 000 up-to-date data series for 186 countries in Global Energy & CO2 data
Additionally, for more detailed information on refineries, you can request a sample of our EMEA Refineries Dataset
Oil Products Consumption
Oil consumption increased by 2% in 2022 to 51 Mt. It rebounded by 6% in 2021 after a 15% decrease in 2020. Previously, oil consumption declined by 2%/year between 2017 and 2019 after a 2%/year increase between 2013 and 2017, led by the transport and petrochemical sectors. In 2022, oil consumption was 25% below its peak level in 2003.
Graph: OIL CONSUMPTION (Mt)
Interactive Chart United Kingdom Refined Oil Products Production
Benefit from up to 2 000 up-to-date data series for 186 countries in Global Energy & CO2 data
Additionally, for more detailed information on refineries, you can request a sample of our EMEA Refineries Dataset
Natural Gas Consumption
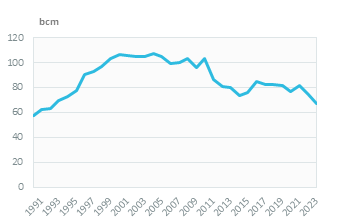
In 2022, natural gas consumption declined by 7.9% (reaching 72 bcm), after experiencing a 6% increase in 2021. In 2020, it decreased by 6%. Between 2016 and 2019, gas consumption was relatively stable at around 80 bcm. Previously, gas consumption increased by 14% between 2014 and 2016, after a 30% decline over 2004-2014.
Graph: NATURAL GAS CONSUMPTION (bcm)
Interactive Chart United Kingdom Natural Gas Domestic Consumption
Benefit from up to 2 000 up-to-date data series for 186 countries in Global Energy & CO2 data
Additionally, for more detailed information on the LNG trade, you can request a sample of our EMEA LNG Trade Dataset
Coal Consumption
Coal consumption declined by nearly 15% in 2022 to 7.3 Mt, after having increased by 4% in 2021 following a slight rebound in coal-fired generation. In 2020, it dropped by 9%. Previously, it had decreased by 21%/year between 2012 and 2020 due to the closure of numerous coal-fired power plants.
Graph: COAL CONSUMPTION (Mt)
The industry sector accounted for 47% of coal consumption in 2022, followed by the power sector with 37% (down from 88% in 2012).
Interactive Chart United Kingdom Coal and Lignite Domestic Consumption
Benefit from up to 2 000 up-to-date data series for 186 countries in Global Energy & CO2 data
View the detailed consumption trends at country level (graphs, tables, analysis) in the United Kingdom energy report
Power Consumption
In 2022, electricity consumption declined by 4.5% to 281 TWh. In 2021, it rebounded by 1.2% after a 5.2% drop in 2020. Between 2005 and 2019, electricity consumption declined on average by 1.2%/year. In 2022, electricity consumption was 24% below its peak level in 2005.
Graph: ELECTRICITY CONSUMPTION (TWh)
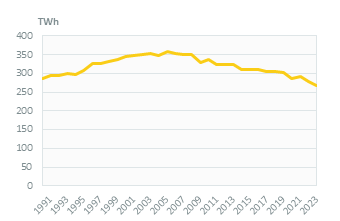
Households are the main electricity consumers (35%), followed by services (29%) and industry (30%).
Renewable in % Electricity Production
In April 2023, the government committed to fully decarbonise the power system by 2035. This commitment includes the development of up to 50 GW of offshore wind by 2030 (5 GW of which is floating offshore wind) and a final investment decision on a large-scale nuclear plant. In 2020, the National Infrastructure Commission (NIC) updated its target for deployment of renewables as part of a carbon-free electricity system, from 50% to 65% of the power mix by 2030 (44% in 2022).
The target of 20 GW of solar in 2020 set in the Solar Strategy of 2014 was not reached (14 GW end of 2020).
Interactive Chart United Kingdom Share of Renewables in Electricity Production (incl hydro)
Benefit from up to 2 000 up-to-date data series for 186 countries in Global Energy & CO2 data
Learn more about renewables in the European Battery Market Analysis
CO2 Fuel Combustion/CO2 Emissions
GHG emissions have been decreasing rapidly since 1990. After a sharp 9.5% reduction in 2020, GHG emissions increased by 5% in 2021 before decreasing by 2.2% in 2022 to 417 MtCO2eq, according to preliminary statistics.
In its updated NDC (2022), the country aims to reduce its GHG emissions by 68% by 2030 from 1990 level, compared to 53% in the previous NDC. In 2021, the country set into law a new reduction target of 78% in 2035 and reached 60% of this target that same year (47% reduction achieved).